On this page
We've been rebuilding analytics across OnVoard.
Not just adding more charts.
The bigger change is how the reports are structured. Instead of dropping every metric onto one screen, we're separating the questions: did it reach people, did they act, did it lead to a purchase, and what happened after that?
The new reporting is now across Marketing Platform, ActionPop, Back In Stock, Product Recommender, Reviews and Reperks.
Marketing Platform: follow an email from send to sale
Email reporting now starts where email actually starts: delivery.
At the account level you can track Total sends, Delivery rate, Failure rate, Open rate and Click rate, then drill into engagement and attributed revenue.
Open an individual email and you get the same reporting shape scoped to that send, including:
Delivery and failure trends
Open and click performance
Click-to-open rate
Top links by clicks
Delivery problems and complaints
Revenue and conversions
Products sold by units and revenue
The individual email view isn't just for broadcasts either. The same reporting is used for emails from Back In Stock, Reviews and Reperks.
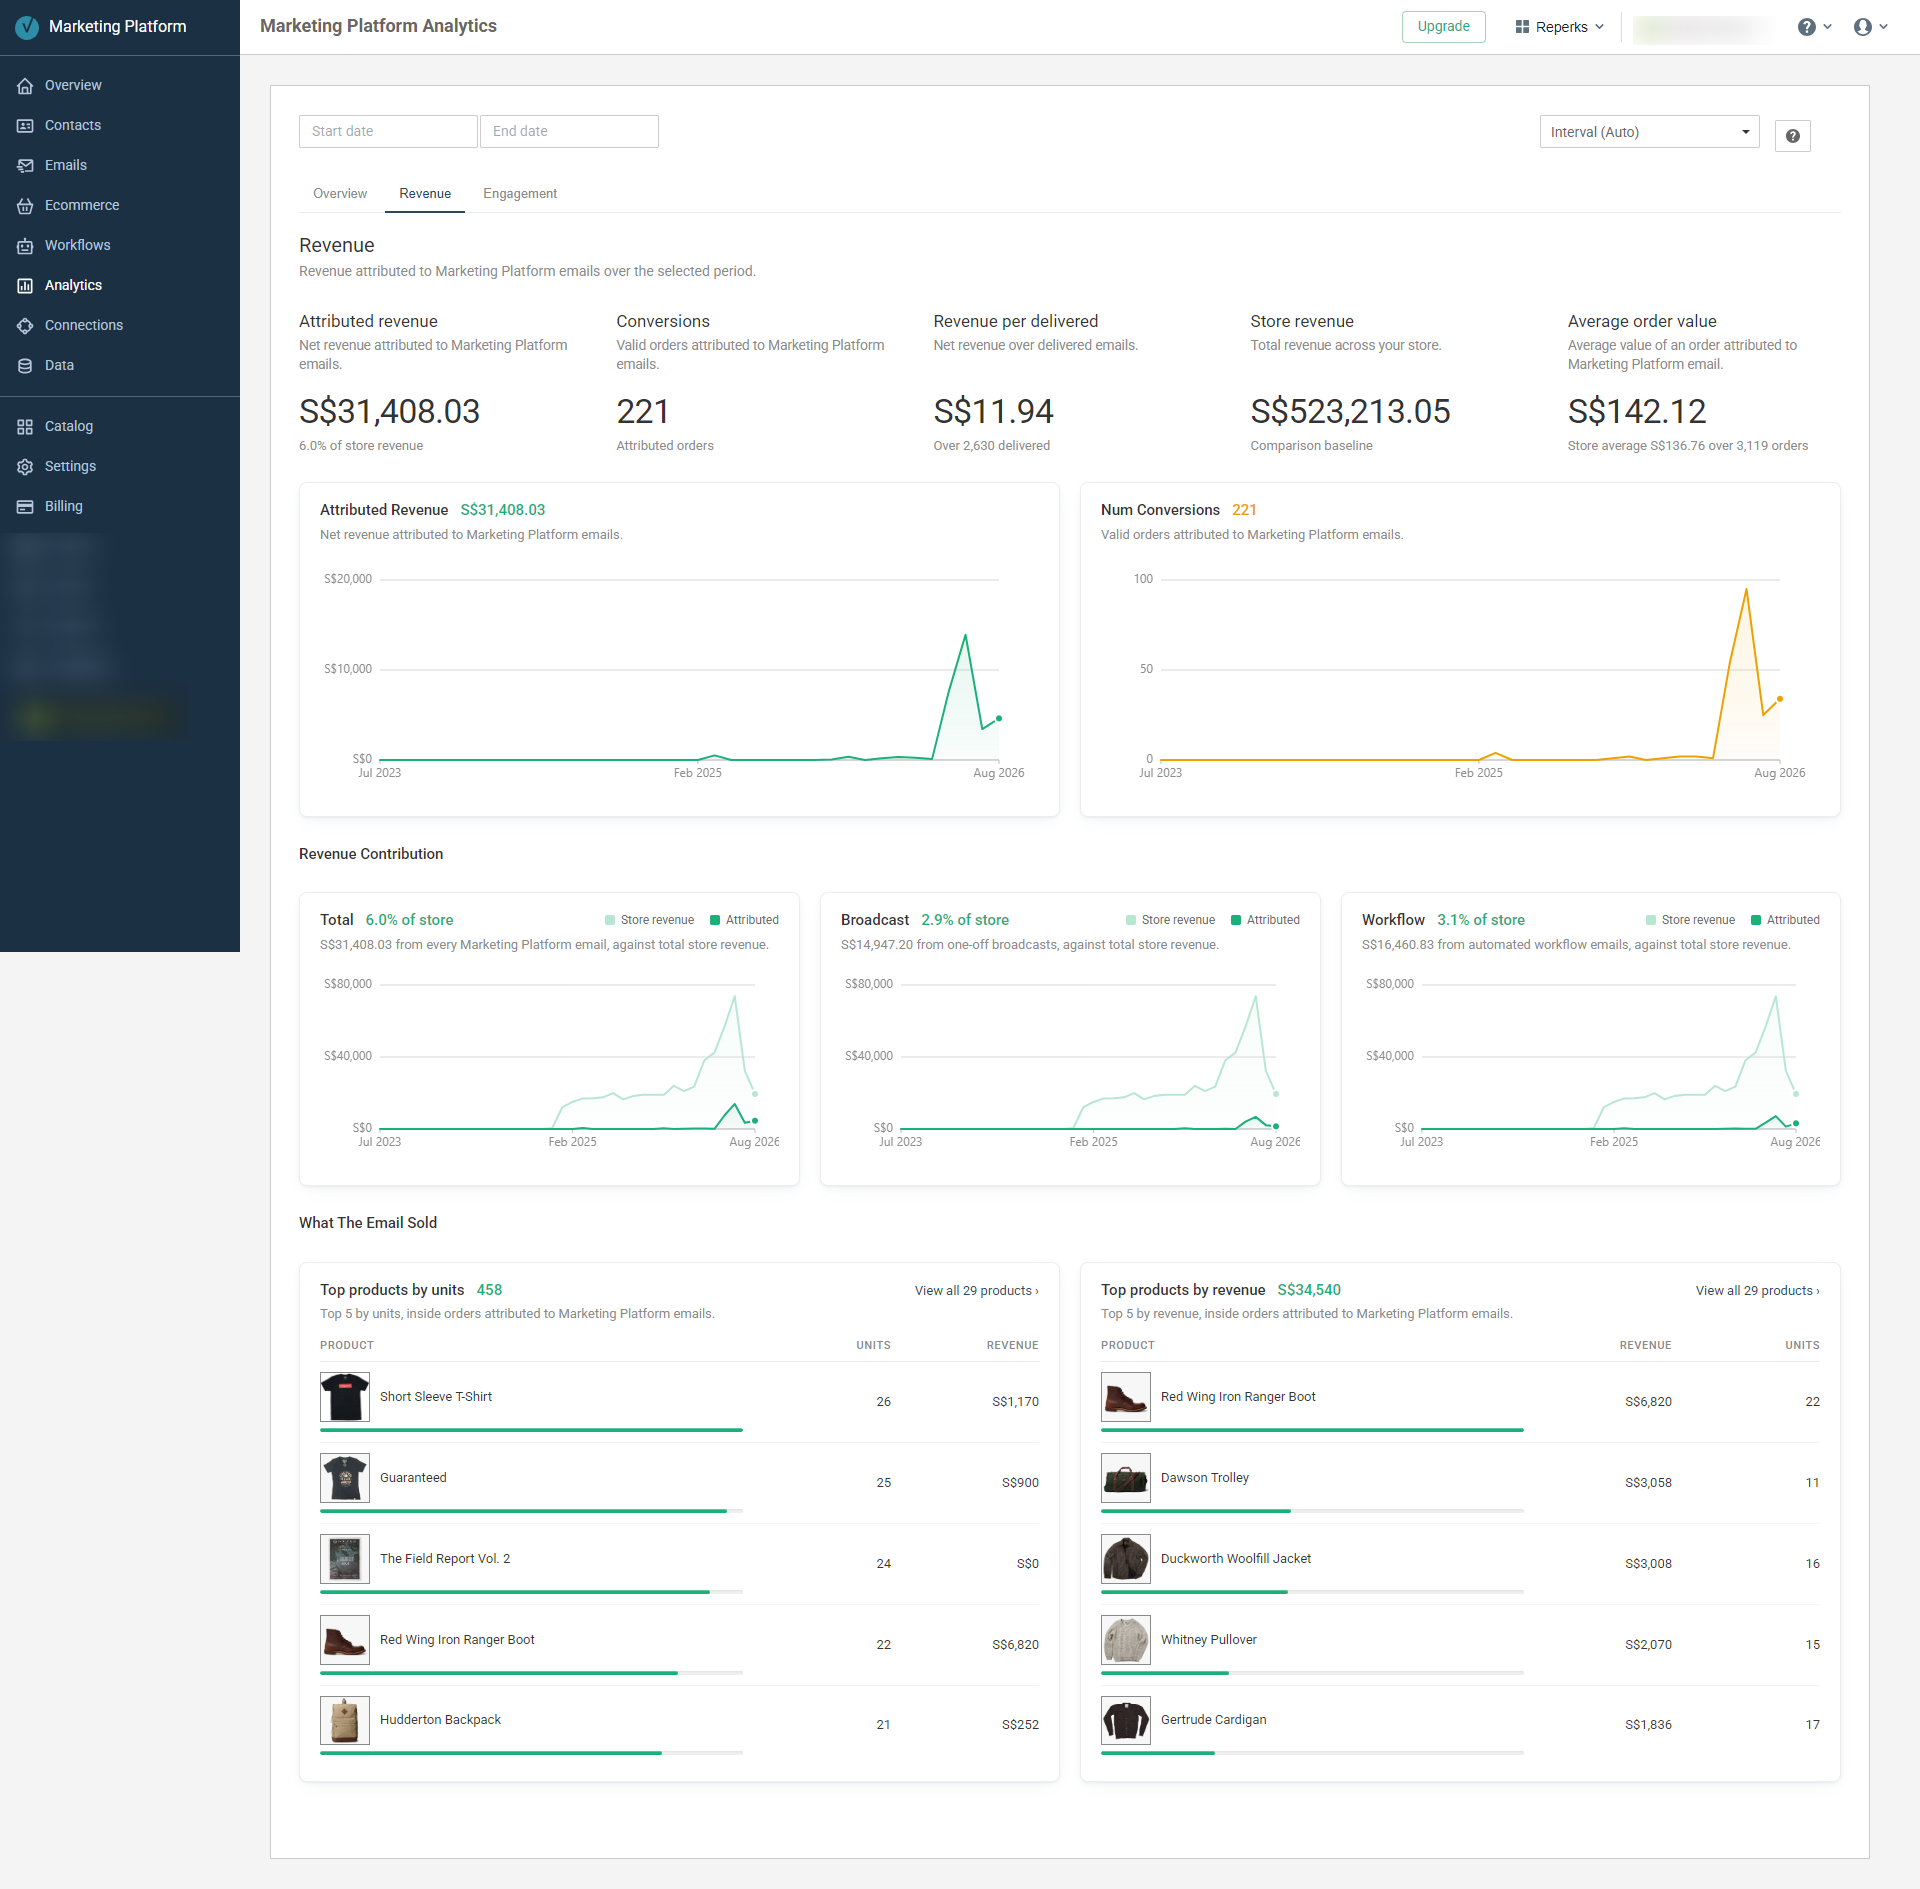
The important bit for us is the order. If delivery is unhealthy, we want you looking at that before spending time optimizing opens.
View Email Marketing Analytics →
Read: Email marketing analytics: check delivery before opens
ActionPop: see what happened after the popup
ActionPop Analytics now follows campaigns beyond impressions.
Across all campaigns you can see Impressions, Engagement rate, Submission rate and Assisted revenue, with the underlying counts and activity over time.
Revenue reporting then ranks campaigns by assisted revenue and shows which products appeared most often and carried the most revenue inside those orders.
The Engagement tab keeps Engaged, Submitted and Purchased against the same impressions base, with spam-blocked submissions called out separately when response quality needs attention.
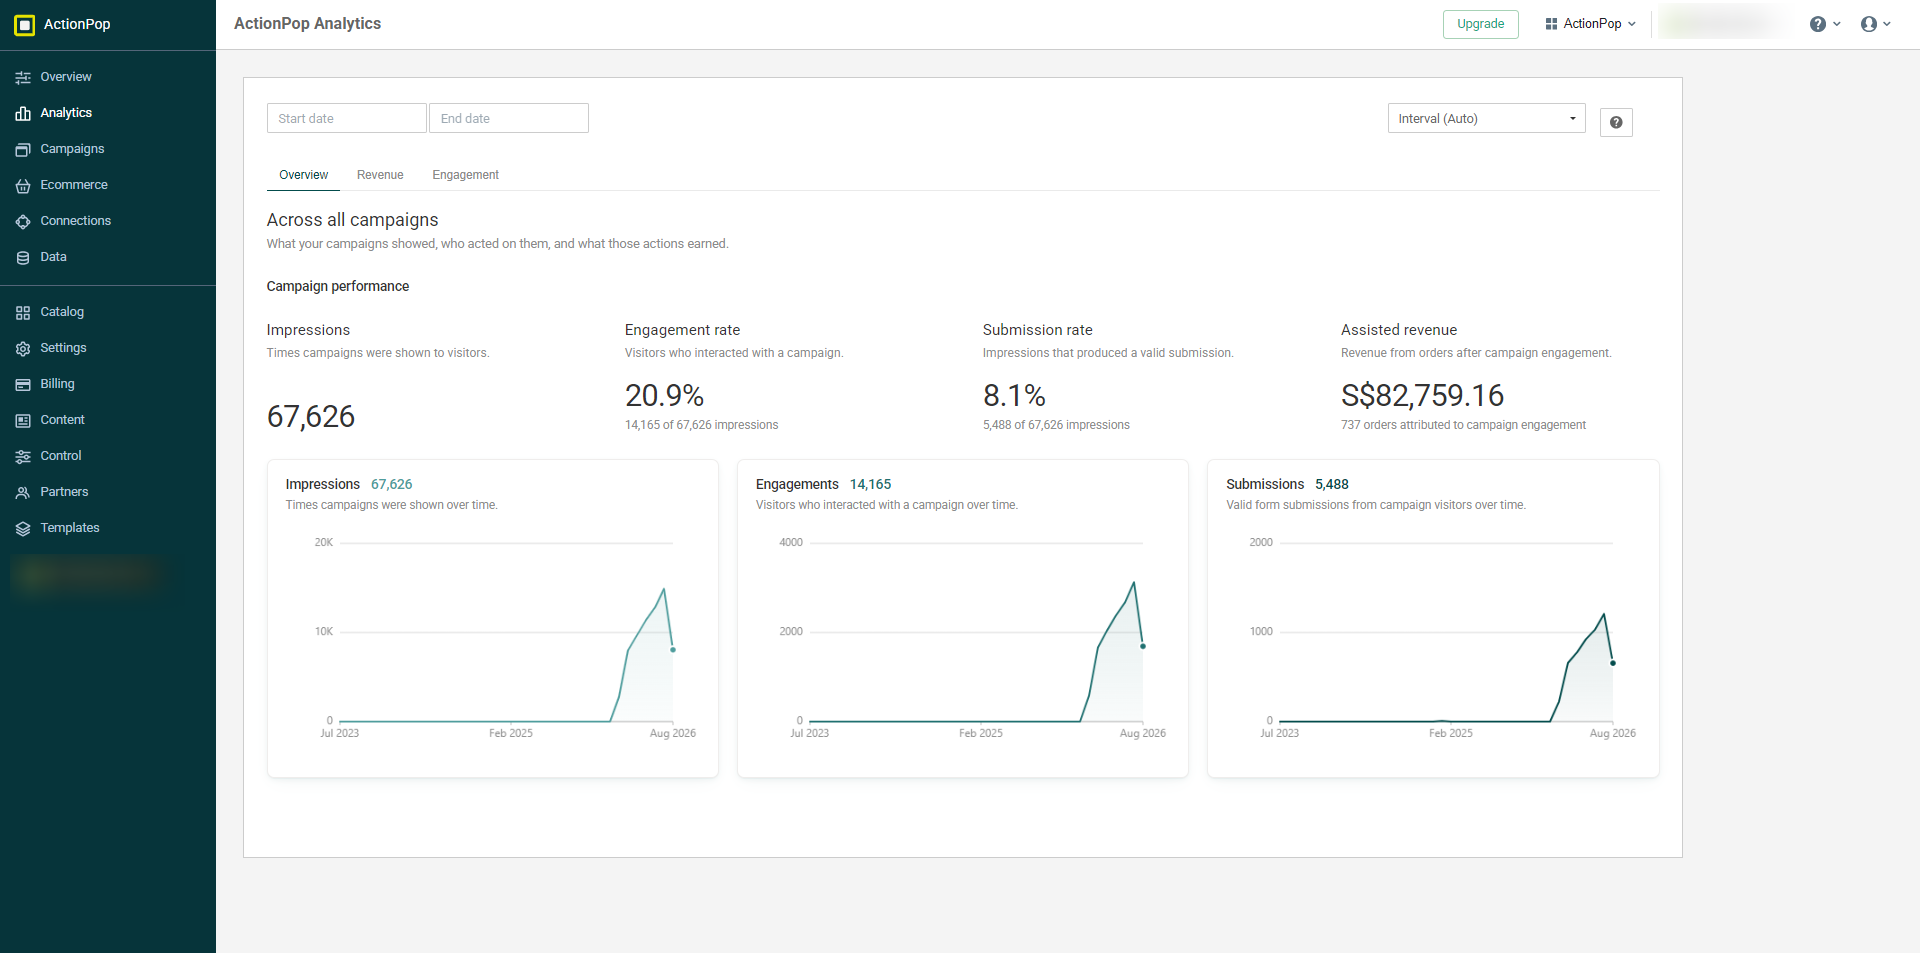
We deliberately call the revenue here assisted revenue.
It means an order followed campaign engagement. It doesn't mean the popup caused the order. That's a weaker claim than email attribution, and the reporting now says so instead of letting a large revenue number blur the distinction.
Read: ActionPop popup analytics: did it actually help the sale?
Back In Stock: follow demand through recovery
Back In Stock reporting now separates 2 questions.
Recovery Funnel shows what happened after shoppers subscribed: how many were notified, how many bought, delivery performance and revenue recovered.
Demand looks forward instead: what shoppers are currently waiting for, how many sign-ups are coming in, notifications being sent and the revenue attached to those notifications.
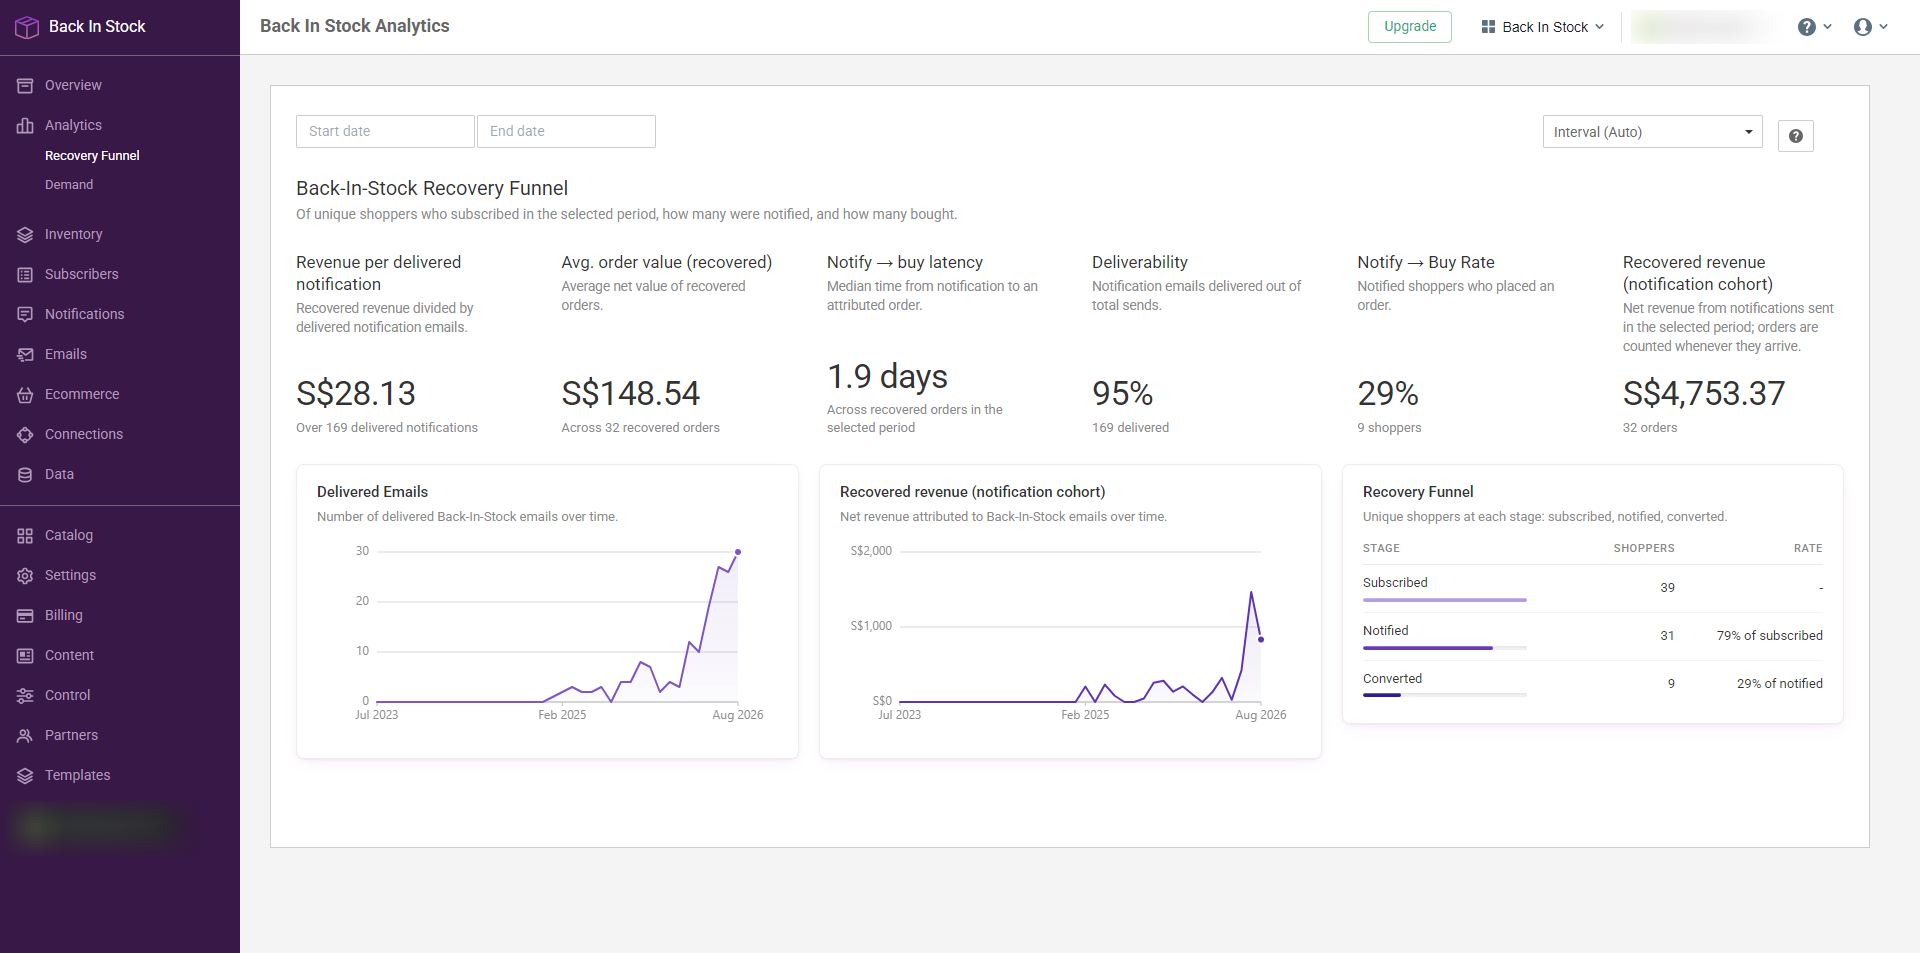
That means you can use the same analytics area for both sides of the job: measure what previous restocks recovered and see where current demand is building.
View Back In Stock Analytics →
Read: We rebuilt Back In Stock's reporting
Product Recommender: clicks aren't the finish line
Product Recommender now follows recommendations from Impressions to Clicks to Conversions across the account.
Open an individual recommender and you can separate:
Click rate
Conversion rate
Overall rate
Assisted revenue
Revenue per click
Revenue per sale
Products earning assisted revenue
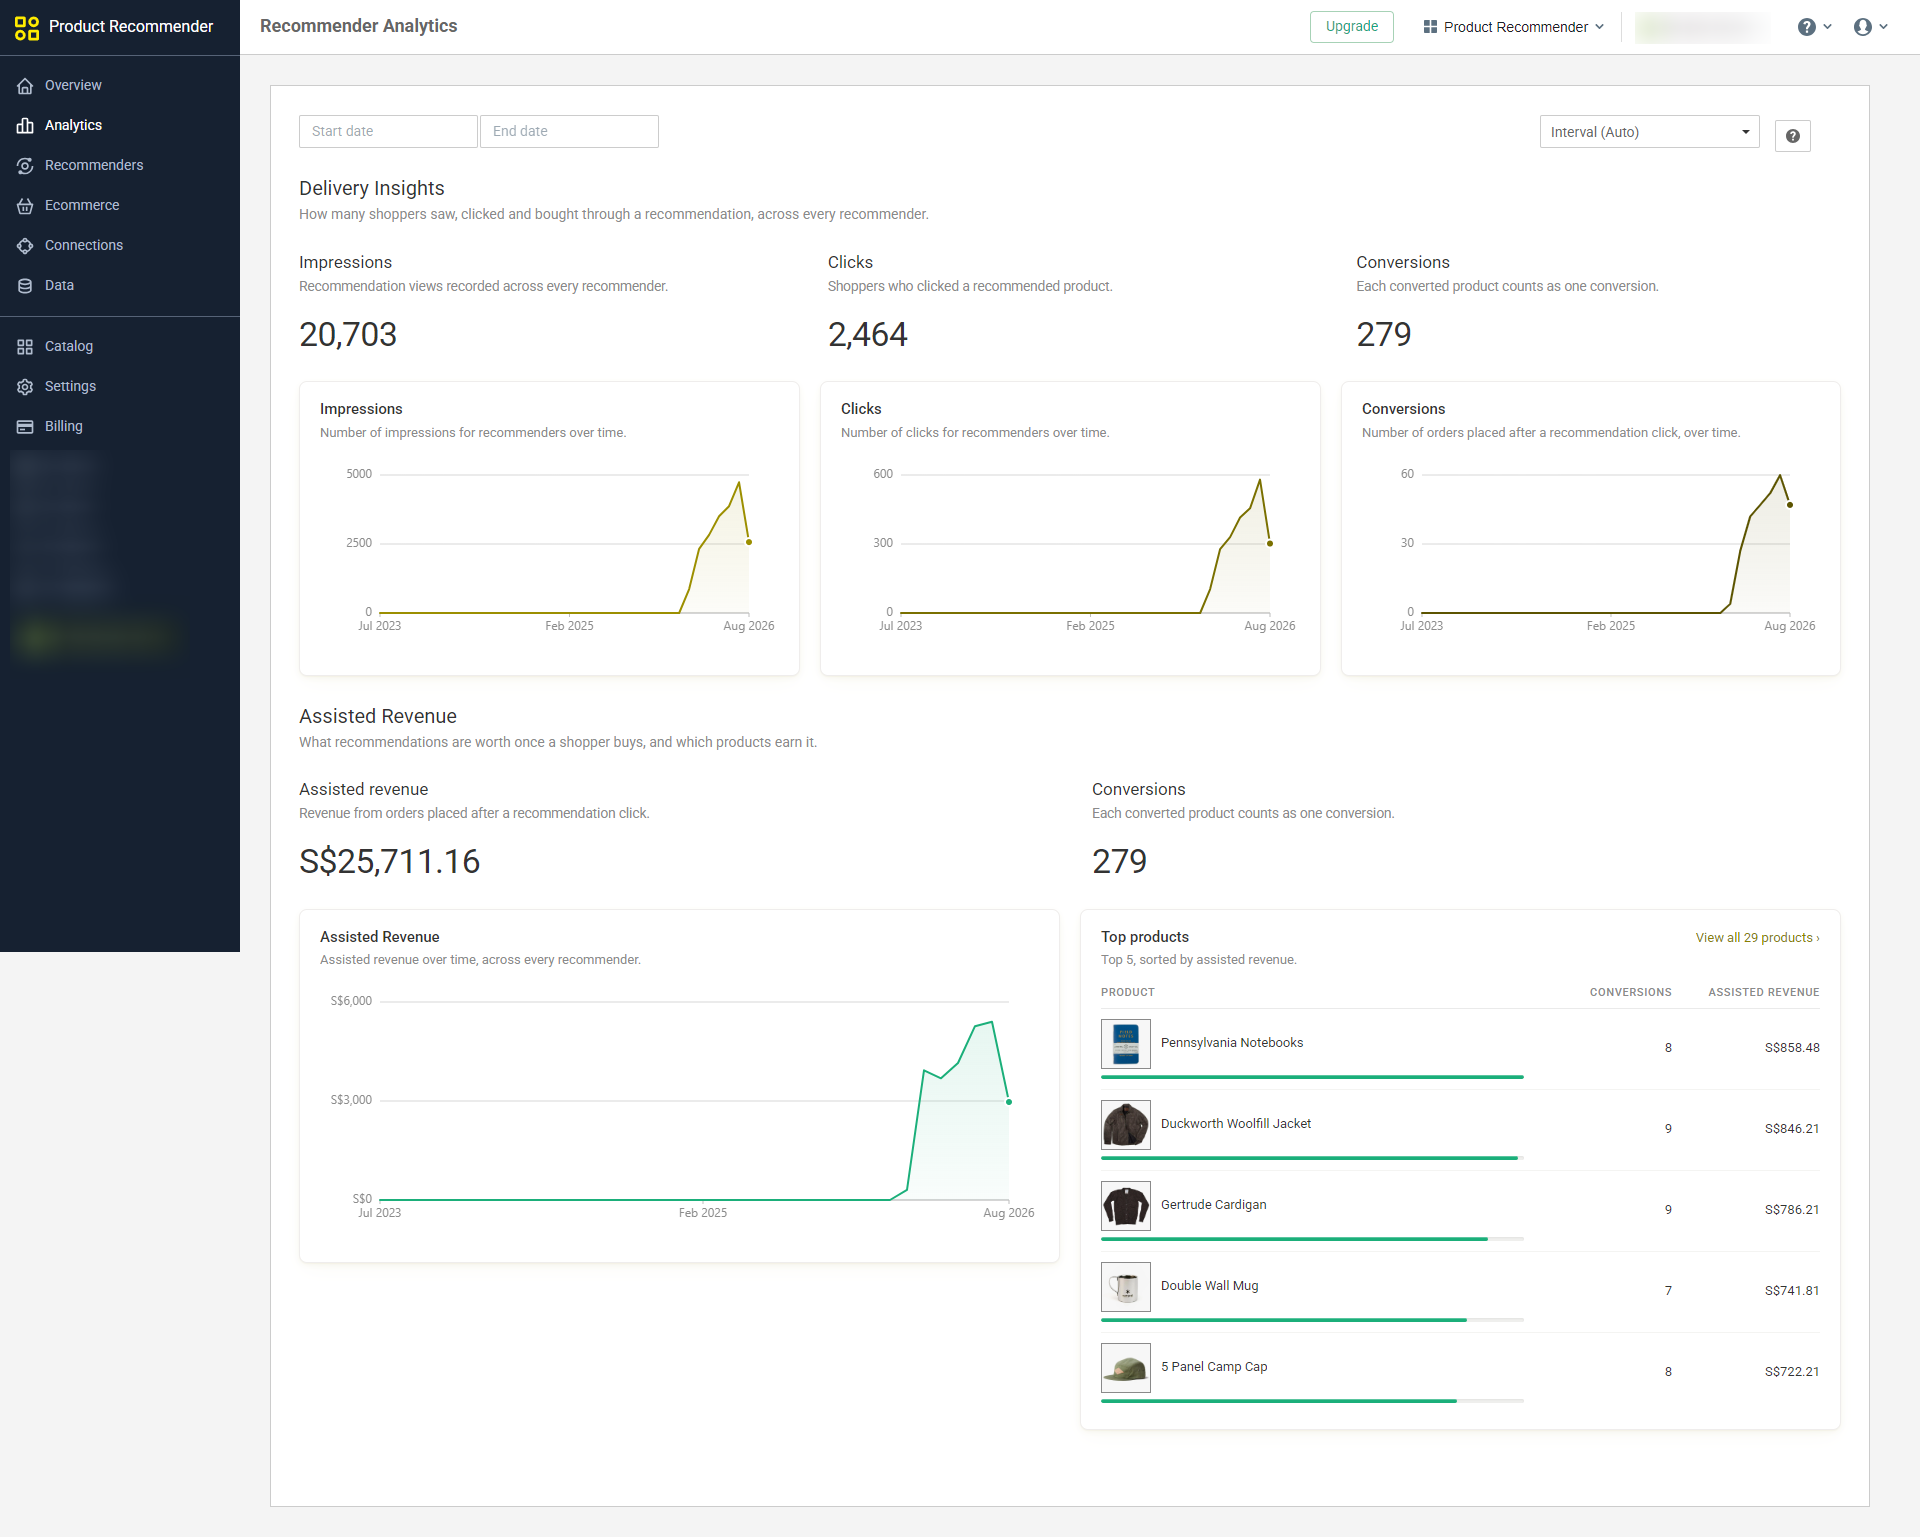
Same assisted revenue distinction as ActionPop: a purchase after a recommendation click means the recommendation was part of the journey, not that it created the demand. The more useful question is whether impressions turn into clicks, clicks into purchases, and whether those clicks are commercially worth anything.
View Product Recommender Analytics →
Read: Product recommendation analytics beyond clicks
Reviews: go beyond the average rating
Reviews Analytics now separates collection, revenue and quality.
You can see where reviews are coming from, which products are collecting the most feedback and whether collection is still moving.
Quality reporting breaks out the rating distribution, lowest-rated products, verified purchases, reviews with media, replies and moderation work still waiting.
And review emails now have their own attributed revenue reporting, including conversion rate, conversion value and revenue per email.
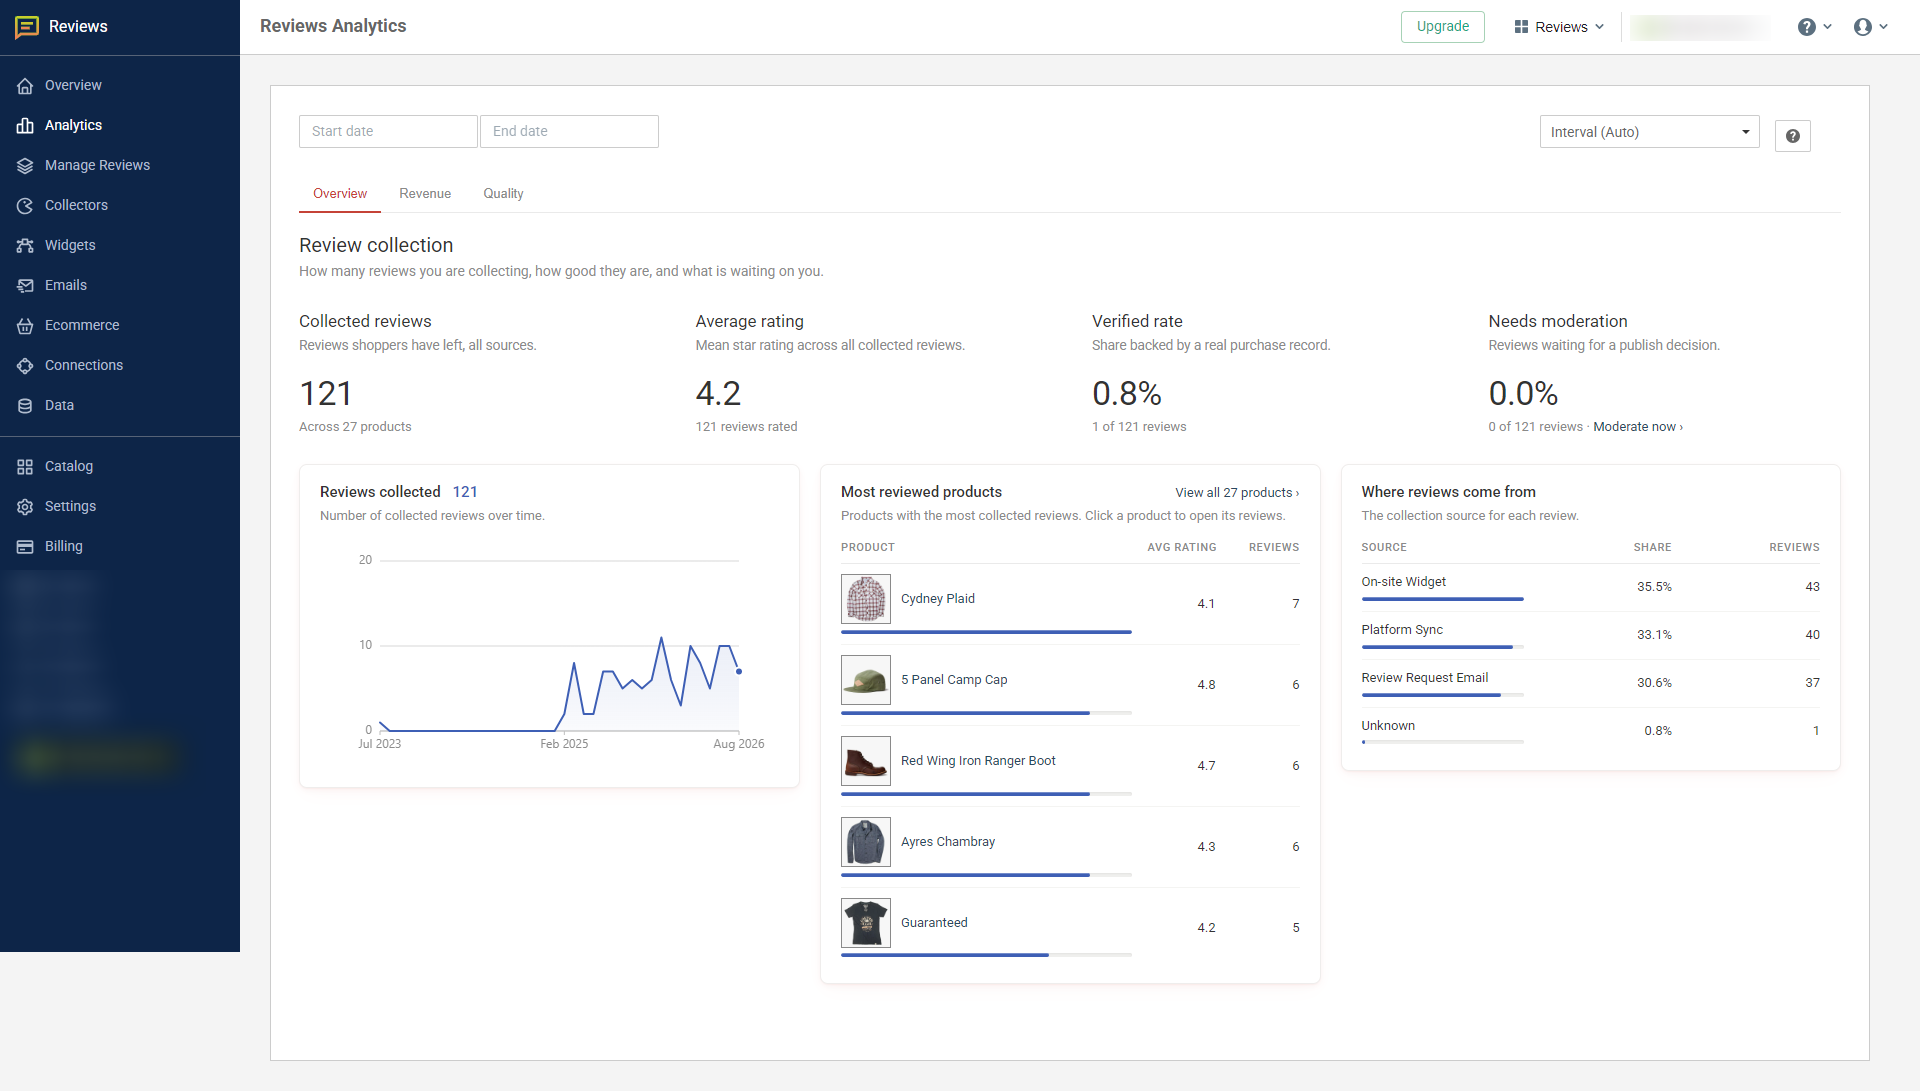
Average rating still matters. We just don't think it should hide everything underneath it.
Read: Reviews analytics beyond your average rating
Reperks: see whether people actually use the loyalty program
Reperks now has dedicated reporting for Overview, Revenue, Points and Customers.
You can follow the points economy from earning through redemption, see where awarded points eventually went, inspect which earning rules and rewards are being used, and follow reward codes into orders.
Customer reporting then compares members, non-members, redeemers and non-redeemers across spend, purchase frequency and AOV.
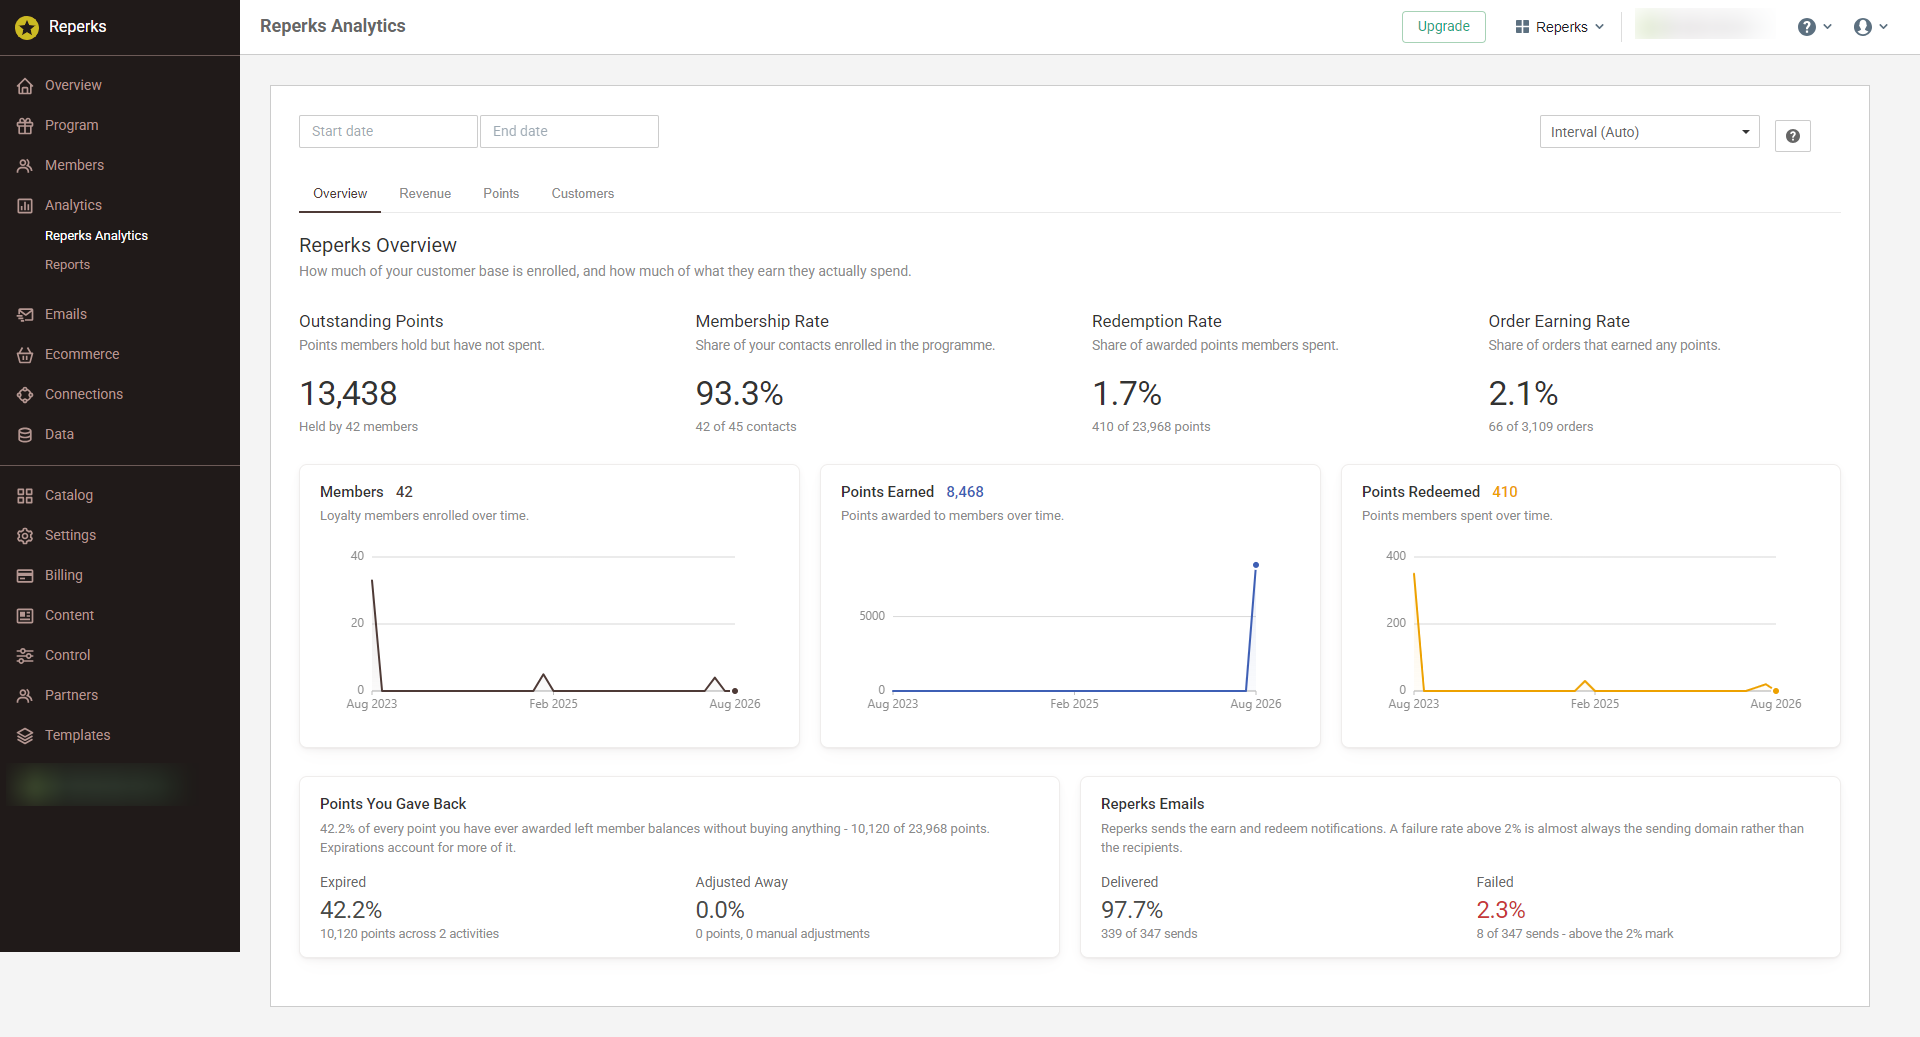
We're especially careful here not to treat "revenue from members" as proof the loyalty program caused that revenue.
Membership tells you who belongs to the program.
Redemption and reward usage tell you whether they're actually using it.
Read: Reperks loyalty program analytics: 4 numbers that show if it pays
One reporting pattern across the platform
The apps do different jobs, so the metrics shouldn't be identical.
But the reporting experience should feel familiar.
Pick a date range, see the important numbers first, then drill into the behavior that produced them.
Where the evidence supports different strengths of claim, we name them differently: attributed revenue ties to a conversion, assisted revenue means the interaction was part of the path before the purchase.
You'll find the upgraded reports under Analytics in each supported OnVoard app.