On this page
A recommendation getting clicked feels like success.
I wouldn't stop there.
A click tells you the shopper found a recommendation interesting enough to inspect. That's useful. But there's still a fairly large gap between "that looked interesting" and "I bought it."
That's the gap I want product recommendation analytics to make obvious.
Product Recommender now gives you the account-wide path from impressions to clicks to converted products. From there, you can open a single recommender and inspect the rates and assisted revenue behind it.
The order matters. A good Click rate can hide a weak purchase rate, while a strong Conversion rate means nothing if barely anyone clicked to see it in the first place. And a big Assisted revenue number can look more certain than it really is if you forget what "assisted" means.
So I wouldn't ask whether recommendations are getting clicks.
I'd ask 3 questions.
Across OnVoard, Product Recommender has assisted $1,400,840 in revenue to date - orders placed after a shopper clicked a recommended product. We call that assisted, not generated: the click was part of the path to that order, and the figure only counts conversions with an order actually attached to them.
Are shoppers getting from recommendation to purchase?
Start with the account-wide Analytics page.
Delivery Insights gives you Impressions, Clicks and Conversions across every recommender.
That's the whole path before money enters the picture.
Impressions tell you how often recommendations were seen, and clicks tell you whether shoppers acted on them. Purchases are the last mile, and conversions mean the recommended product actually got bought after that click.
The charts underneath show each stage over time. Read them together rather than celebrating any total on its own.
If impressions climb but clicks don't, the recommendations are getting exposure without earning attention.
If clicks climb but conversions don't follow, shoppers are interested enough to inspect the products but not interested enough to buy them.
Those are different problems. A single recommendation "conversion rate" can't tell you which one you have.
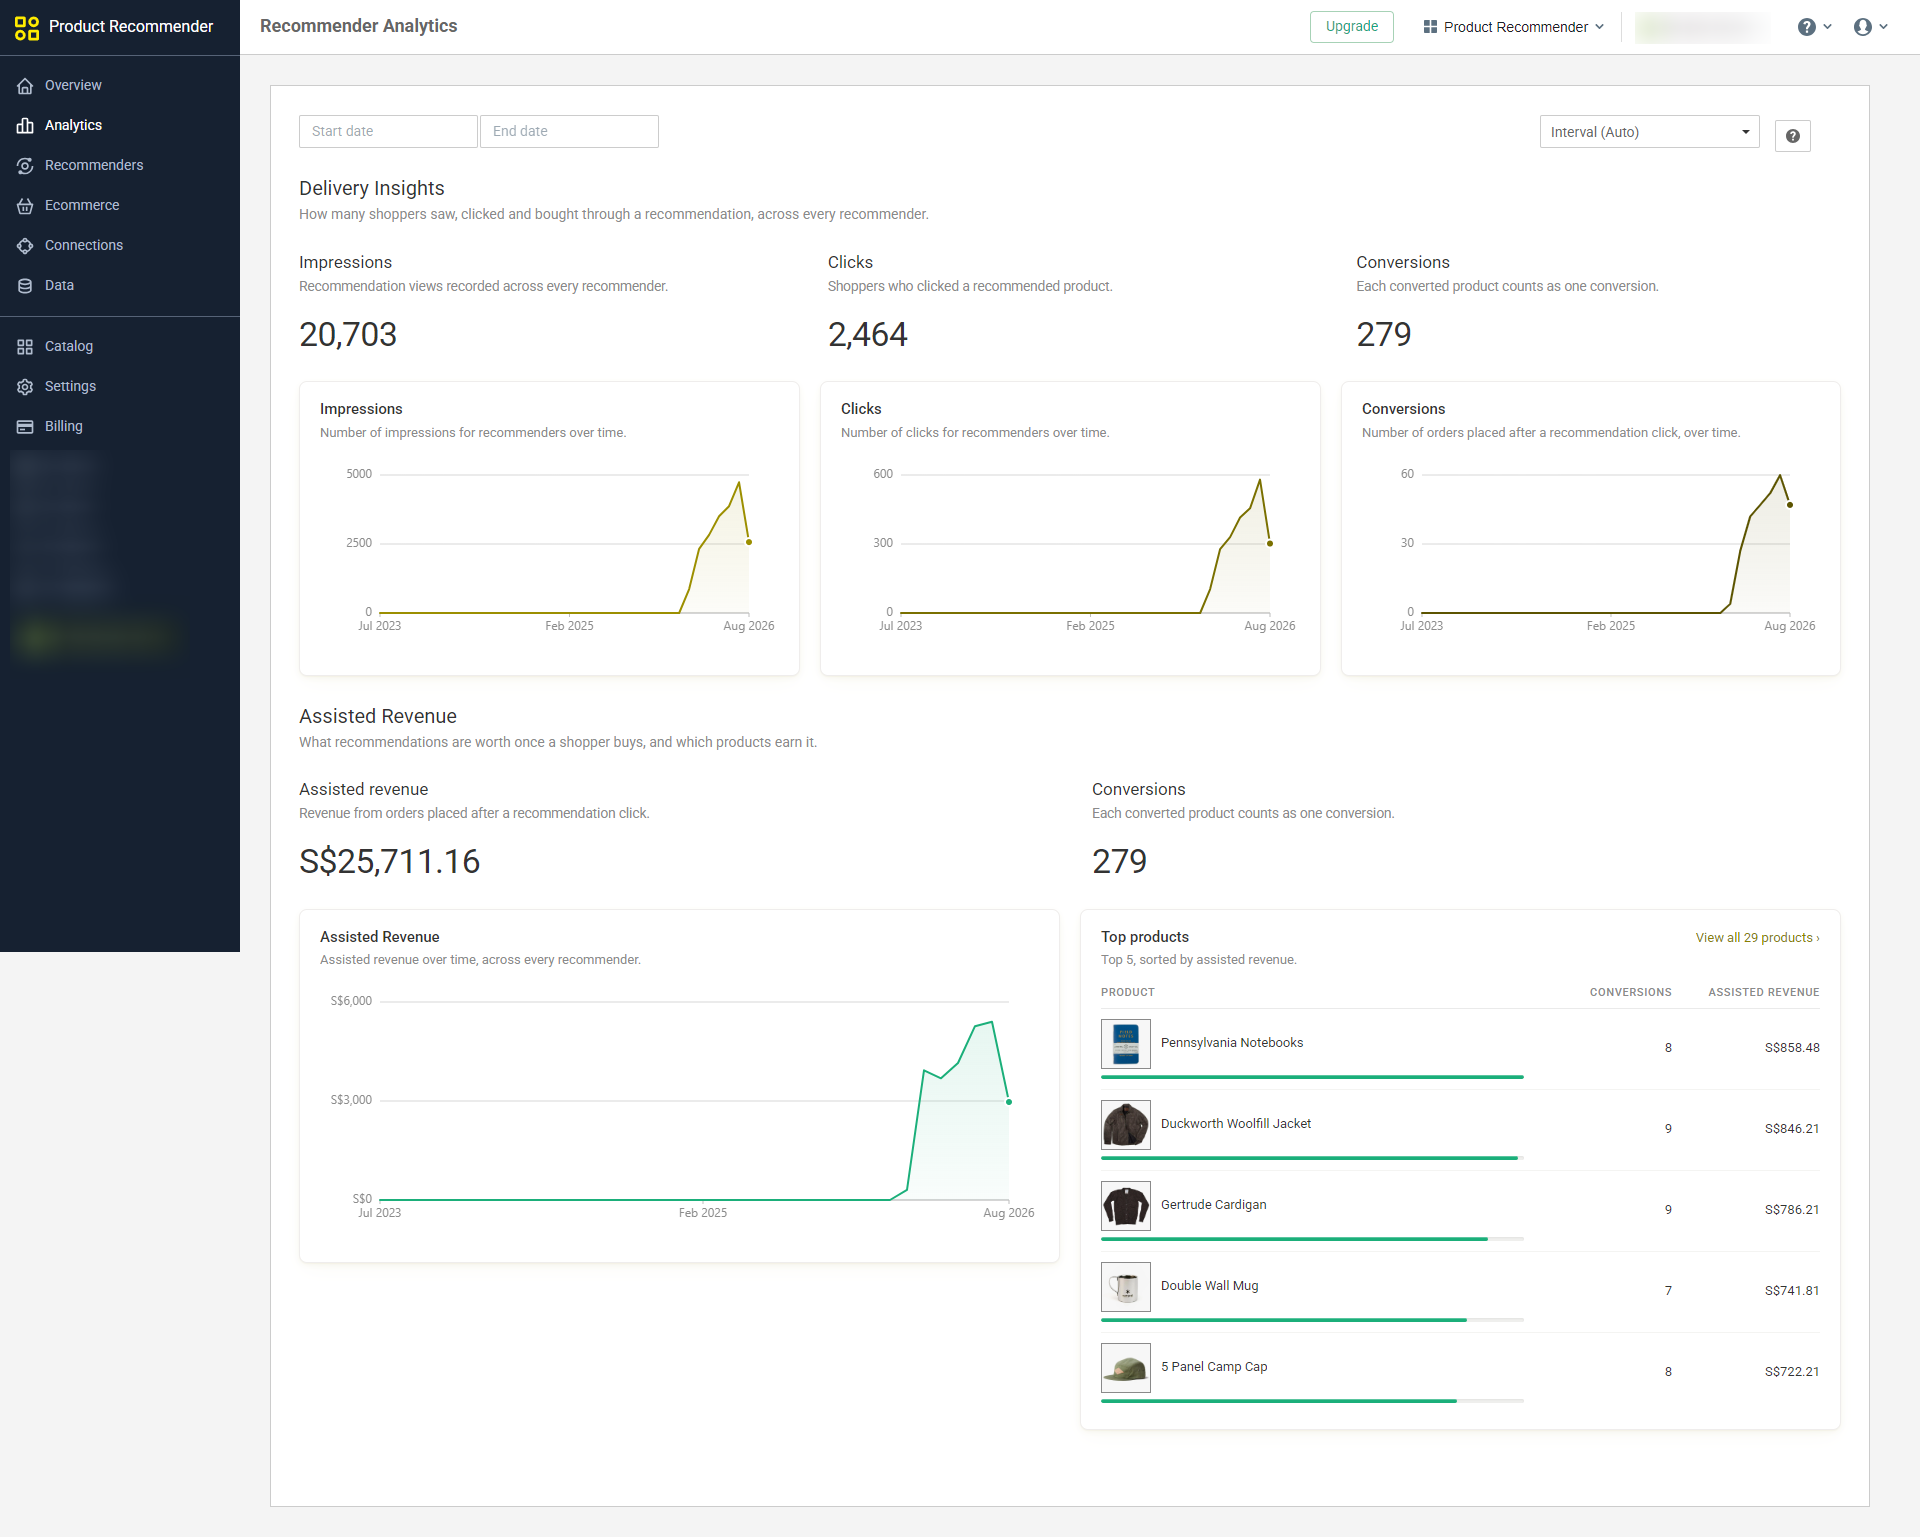
Account-wide Product Recommender analytics puts impressions, clicks and converted products in order before showing the assisted revenue behind them.
Then comes Assisted Revenue.
That wording is deliberate.
Product Recommender connects revenue to products purchased after a recommendation click. That's one step along the path to purchase, not proof the click caused it.
We call it assisted, not generated - a different strength of claim than email's attributed revenue, and not one to rank against it.
The useful question here is simpler: when recommendation clicks are followed by purchases, how much revenue sits behind those converted products?
The Top products card then ranks the products by assisted revenue, with Conversions beside them.
Inspect that list after the overall number. A revenue total tells you recommendations are associated with commercial activity. The product breakdown tells you where that activity is actually concentrated.
Is this recommender good, or does the account average make it look good?
Account-wide numbers are good for spotting a pattern.
They're bad at telling you which recommender created it.
Open a single recommender and Overview gives you Impressions, Click rate, Conversion rate and Overall rate.
The denominators are the interesting bit.
Click rate is clicks over impressions.
Conversion rate is conversions over clicks.
Overall rate goes all the way from impressions to conversions.
Overall rate keeps the other 2 honest.
Imagine a recommender gets clicked by the small number of shoppers who notice something they really want. Its Conversion rate could look strong while its Click rate is weak. The shoppers who click buy, but hardly anyone clicks.
The reverse can happen too - a recommender that's great at earning curiosity and poor at turning that curiosity into a purchase. Overall rate closes the loop.
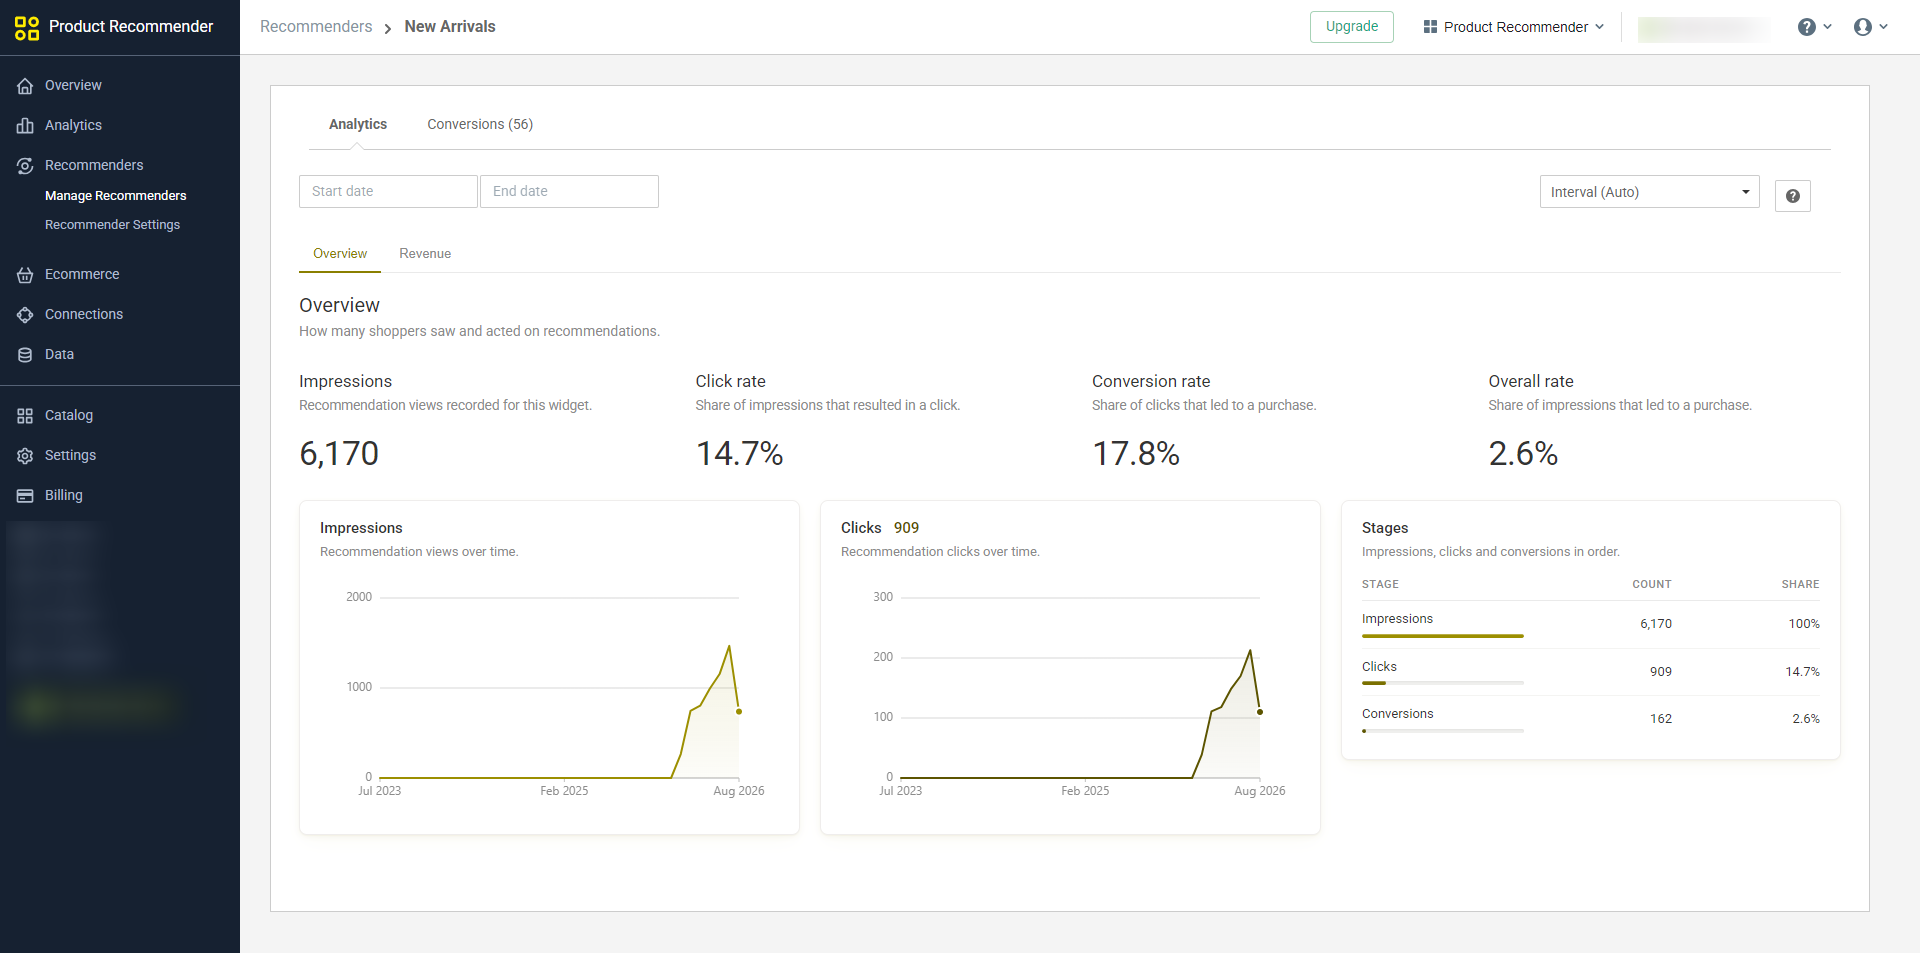
A single recommender separates Click rate from Conversion rate, then shows Overall rate from impression all the way to conversion.
The Stages card makes the same thing visible as counts: Impressions, Clicks and Conversions in order.
Rates are easier for comparing performance; counts stop a nice-looking percentage from distracting you from tiny volume.
And the charts for Impressions and Clicks give you the time dimension. A lifetime rate can look fine even after a recommender has stopped getting much traffic. If the recent line has gone flat, the total won't warn you.
Open the individual recommender before changing anything.
The account tells you something happened, but it's the individual recommender that tells you where to look next.
Is the revenue actually worth the clicks?
Now open that recommender's Revenue tab.
You get Assisted revenue, Conversion rate, Revenue per click and Revenue per sale.
I wouldn't start with the biggest number - I'd start with Revenue per click.
Total assisted revenue rewards scale. More clicks give a recommender more chances to end up attached to purchased products.
Revenue per click asks a harder question: what was the assisted revenue worth relative to the amount of recommendation traffic it took to get there?
Read Conversion rate beside it.
If Revenue per click is weak, the rate helps explain why. Maybe shoppers click but don't buy, or maybe they buy products that carry less value to begin with.
Revenue per sale gives you the other side: assisted revenue over conversions.
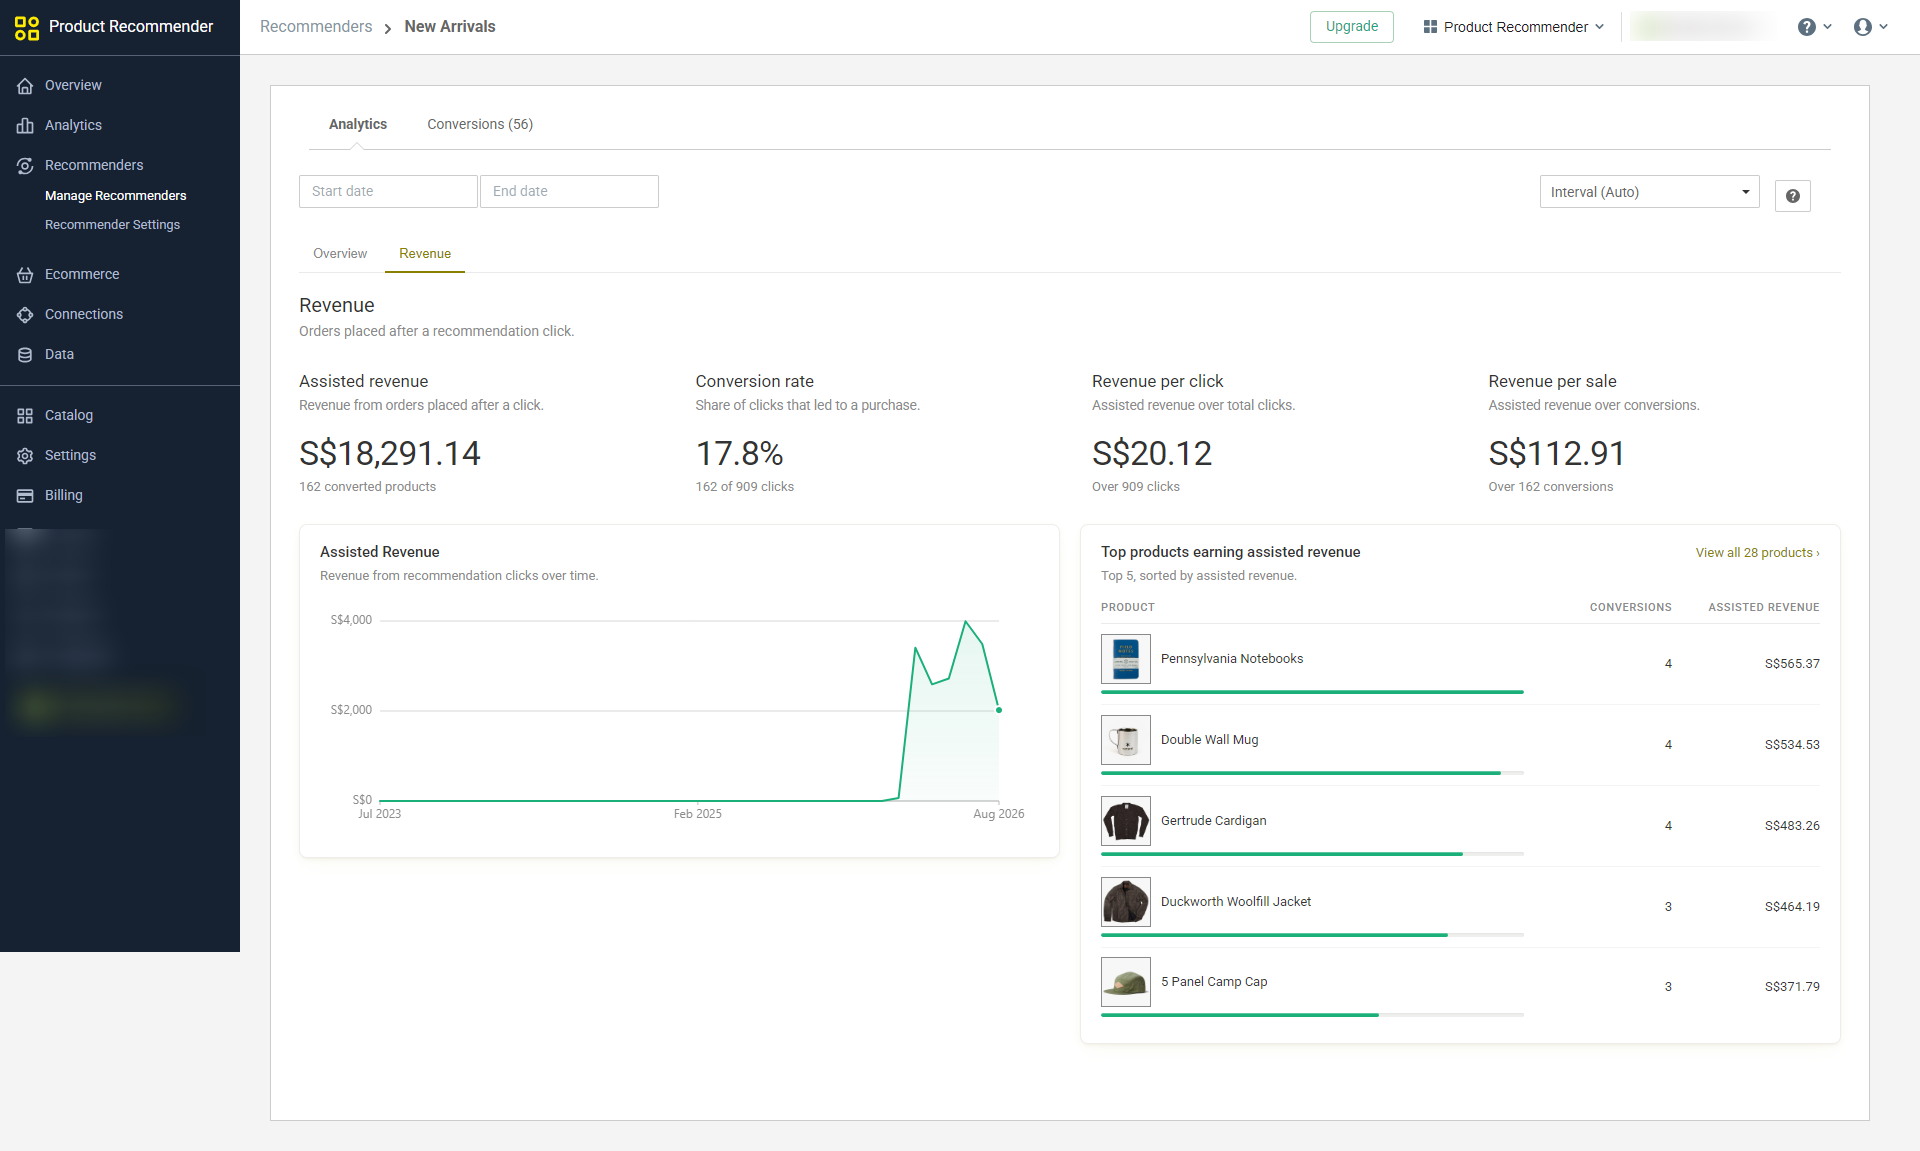
Revenue for a single recommender puts Assisted revenue beside Conversion rate, Revenue per click and Revenue per sale, then shows which products earned the assisted revenue.
Then there's Top products earning assisted revenue.
Go here once the recommender looks commercially useful and you want to know why.
The card ranks products by Assisted Revenue and keeps Conversions beside each product. A product appearing here means it was purchased after a recommendation click and contributed to the assisted revenue recorded for this recommender - it doesn't prove the recommendation created demand for that product.
If a handful of products keep appearing at the top, you've learned something about what shoppers actually act on after seeing this recommender.
What I'd check first
Open Product Recommender Analytics today and skip Assisted revenue for a minute.
Open a recommender and check Click rate, Conversion rate and Overall rate together.
Click rate tells you whether the recommendations earn attention.
Conversion rate tells you what happens after the click.
Overall rate tells you how much of the original recommendation exposure makes it all the way through.
Then go to Revenue and check Revenue per click before the total.
Only after that would I use Assisted revenue and Top products to understand the commercial value sitting behind those clicks.
That's the sequence I'd use for product recommendation analytics: seen, clicked, bought, worth.
Clicks are where the interesting part starts, not where I'd call the recommender successful.