On this page
A reviews dashboard can make you feel good with one number: average rating.
I wouldn't start there.
Average rating tells you how the reviews you've collected scored. It won't tell you whether collection is still moving. Or whether one product is pulling the average down. And it says nothing about what the emails asking for reviews are worth.
That's what the new review analytics in Reviews are for. We split the report into Overview, Revenue and Quality, but I wouldn't read those tabs left to right. Use them to answer 3 questions instead: is collection still moving, are the emails earning anything back, and is the average hiding a product problem.
Are you still collecting reviews?
Start with Collected reviews, then look at Reviews collected over time.
The average rating gets all the attention, but it can sit there looking healthy while collection has gone flat. Set the date range to the period you care about. If new reviews have slowed down, that's the first problem to fix. A beautiful average from old feedback doesn't help you understand what buyers are saying now.
Then look at Where reviews come from.
This is where you check the collection machinery itself. If Review Request Email is supposed to be doing most of the asking but barely appears, go check that flow. If On-site Widget is carrying the load, that's useful too. You can see which source is actually producing the reviews instead of assuming the setup is working because the total keeps moving.
Most reviewed products answers a different question: is your review volume spread across the catalog, or concentrated in a handful of products? A store-level total can hide that pretty easily.
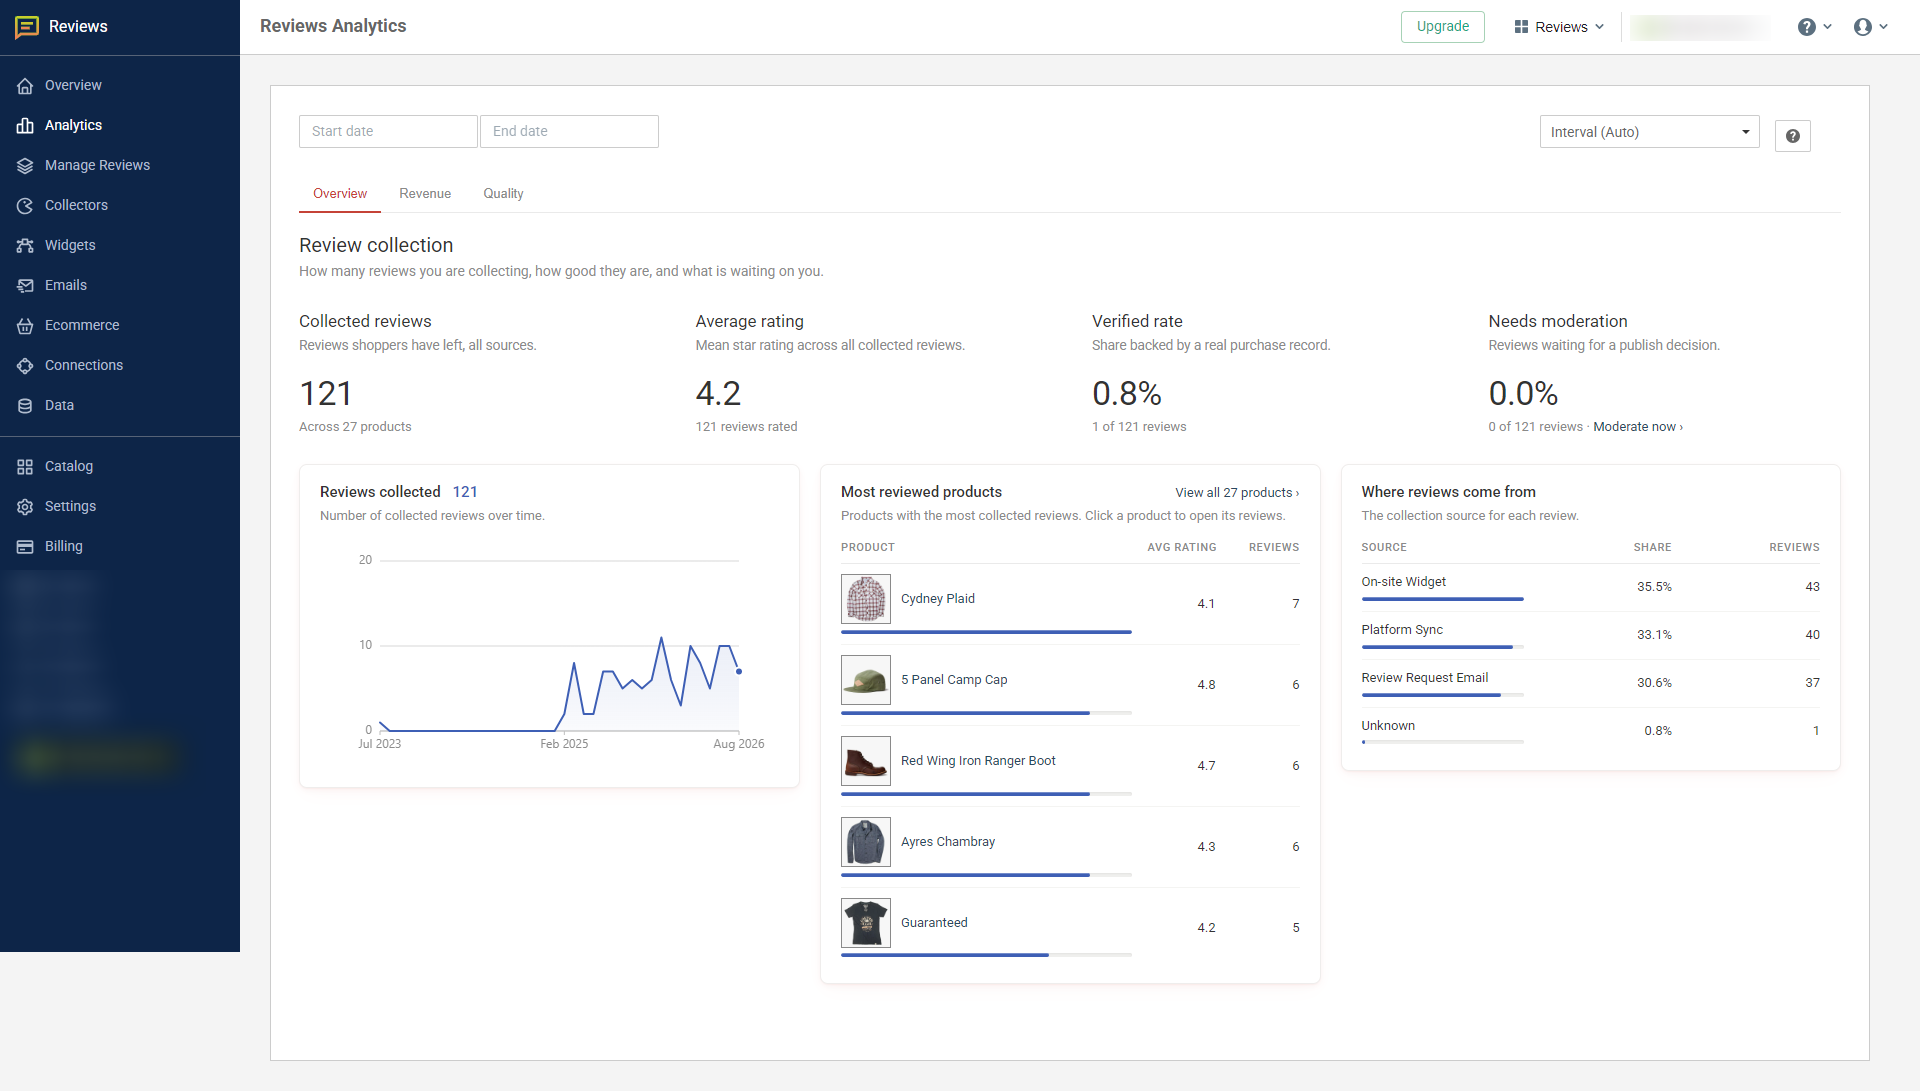
Overview shows Collected reviews, Average rating, Verified rate and Needs moderation, then breaks collection down by product and source.
Read Average rating after those - it's still useful, but only once you know what fed it.
Are the review emails earning anything back?
This is the Revenue tab, and the big Attributed revenue number isn't actually where I'd start.
Reviews emails open at 49.1%, but the click rate is only 5.0%. That's not a flow to fix - a review request asks for a review, not a click to buy, so a low click rate here doesn't mean the same thing it would on a promo email. Judge this tab on revenue and conversion, not clicks.
Start with Revenue per email.
Attributed revenue grows when you send more email. Revenue per email divides that attributed revenue by the number of review emails sent, which makes it much easier to judge the flow against its own earlier periods.
Then read Conversion rate and Conversion value beside it.
Conversion rate is the share of sent review emails that led to a valid order. Conversion value is the average net value of an order attributed to a review email.
Revenue by review email ranks the emails in the review flow by attributed revenue. Open that before changing the whole sequence - a weak email and a weak flow aren't the same problem.
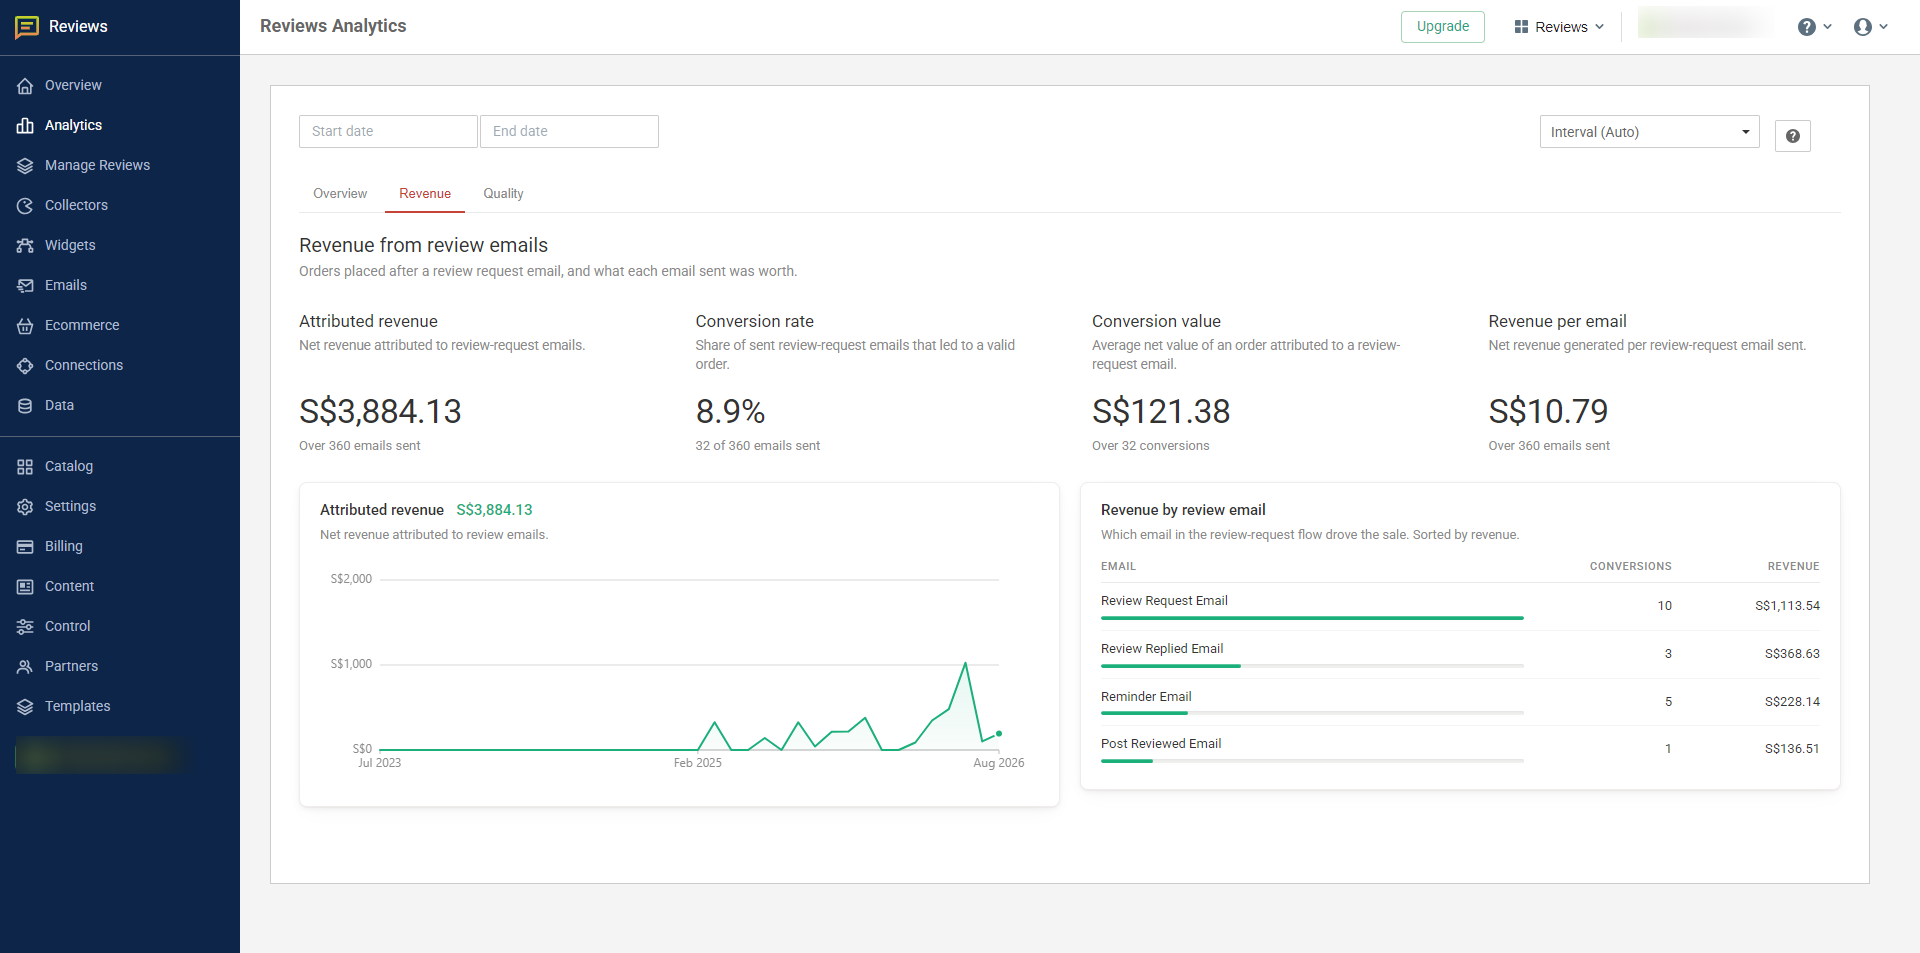
Revenue shows Attributed revenue, Conversion rate, Conversion value and Revenue per email, with the flow broken down in Revenue by review email.
One caveat matters here. Attributed revenue isn't the same as incremental revenue. The order was tied back to one of the review emails in OnVoard. That's useful, but don't read it as a claim that the purchase would have disappeared without the email.
Don't treat the biggest number on the page as the victory lap. Read it with the rate, the value per conversion and the email breakdown.
Is the average hiding a product problem?
Open Quality.
Rating distribution is more useful than the average when you want to know what kind of reviews are underneath it. The average squeezes the 5-star scale into one figure, so I use the distribution when I want to see the mix underneath.
Then go straight to Lowest rated products.
This is the list to act on. It ranks the products dragging down the average and keeps the review count beside the rating. Read both before you react. A low average on very little feedback is a different signal from the same average repeated across a much larger set.
Click the product and you're in its reviews, which is where the useful work starts. Is it the product? Shipping? Sizing? Expectations set by the page? Read the actual reviews and you'll usually know what to investigate next.
The row above gives you 4 more signals: Verified purchase, With photo or video, Replied to and Awaiting moderation.
I wouldn't mash those into one made-up "quality score". Verified purchase tells you what OnVoard could match to a real order. Photo or video tells you how much review media you've collected. Replied to tells you what you've answered publicly. Awaiting moderation is work still waiting on a publish decision.
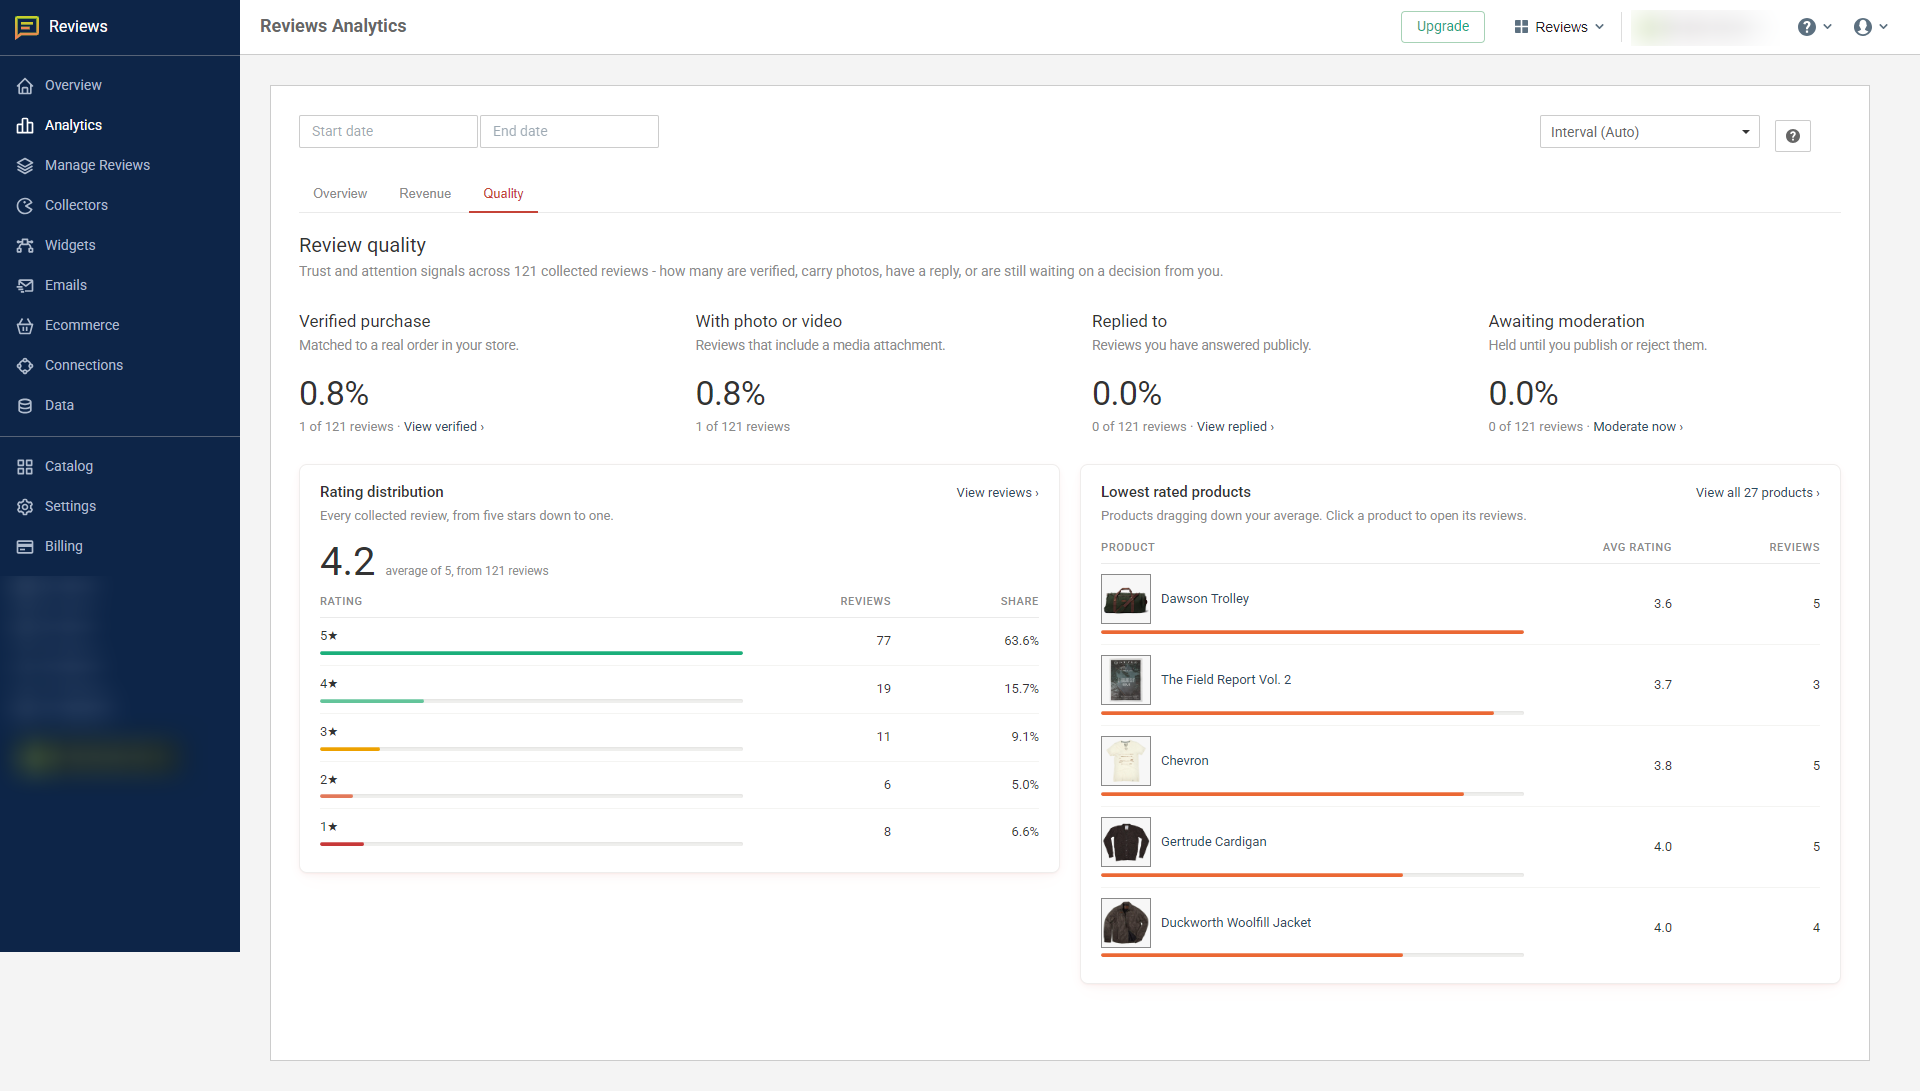
Quality shows the rating distribution, Lowest rated products and the trust or attention signals around the reviews you've collected.
If anything is Awaiting moderation, that's the easy one. Clear the queue. After that I'd open the lowest-rated products before worrying about moving the storewide average by a decimal point.
Check this first
If you open Reviews Analytics today, go to Overview and ignore Average rating for a minute.
Start with Reviews collected over time and Where reviews come from.
If collection is flat or the source you expect isn't producing reviews, fix that first. Once reviews are coming in, open Quality and work down Lowest rated products. Revenue comes after that, because there's no point optimizing the economics of a review-request flow that isn't collecting the reviews you wanted in the first place.
That's the order I'd use: collection, problems, then money.