On this page
A restock alert earns $54 for every email delivered, more than any other email OnVoard sends. Delivered, not opened, not clicked, not anything further down.
That's 25 times the $2.16 average across everything we send, because it reaches someone who had already decided to buy and just couldn't.
They open it too: 63% on average, because they're the ones who asked to be told.
So back-in-stock flow is a proven and profitable flow across all metrics. Then what's the challenge in optimizing back-in-stock flow? Knowing what to bring back.
Prior to this update, you could see who was waiting. Whether any particular waitlist was worth doing something about, you had to guess. 400 people spread across 900 variants is a spreadsheet, not a decision.
That's what we spent the last few weeks on. Demand now breaks down by brand and by product, the inventory page got a real set of filters, and the export finally includes the numbers. I'll come back to that last one, it was overdue.
Easiest way to show any of it is with the questions you can now actually answer.
Inventory Page Updates
Which product made me the most money this year?
Inventory page. Set the date range to this year, sort by Revenue Recovered, read the top row.
That figure is net revenue from people who got an alert and then bought. Not clicks, not sign-ups.
One thing the date range does that you might not expect: it also drops every item nobody asked about in that window. So you get this year's list, not your whole catalog with a column of zeros running down the side of it.
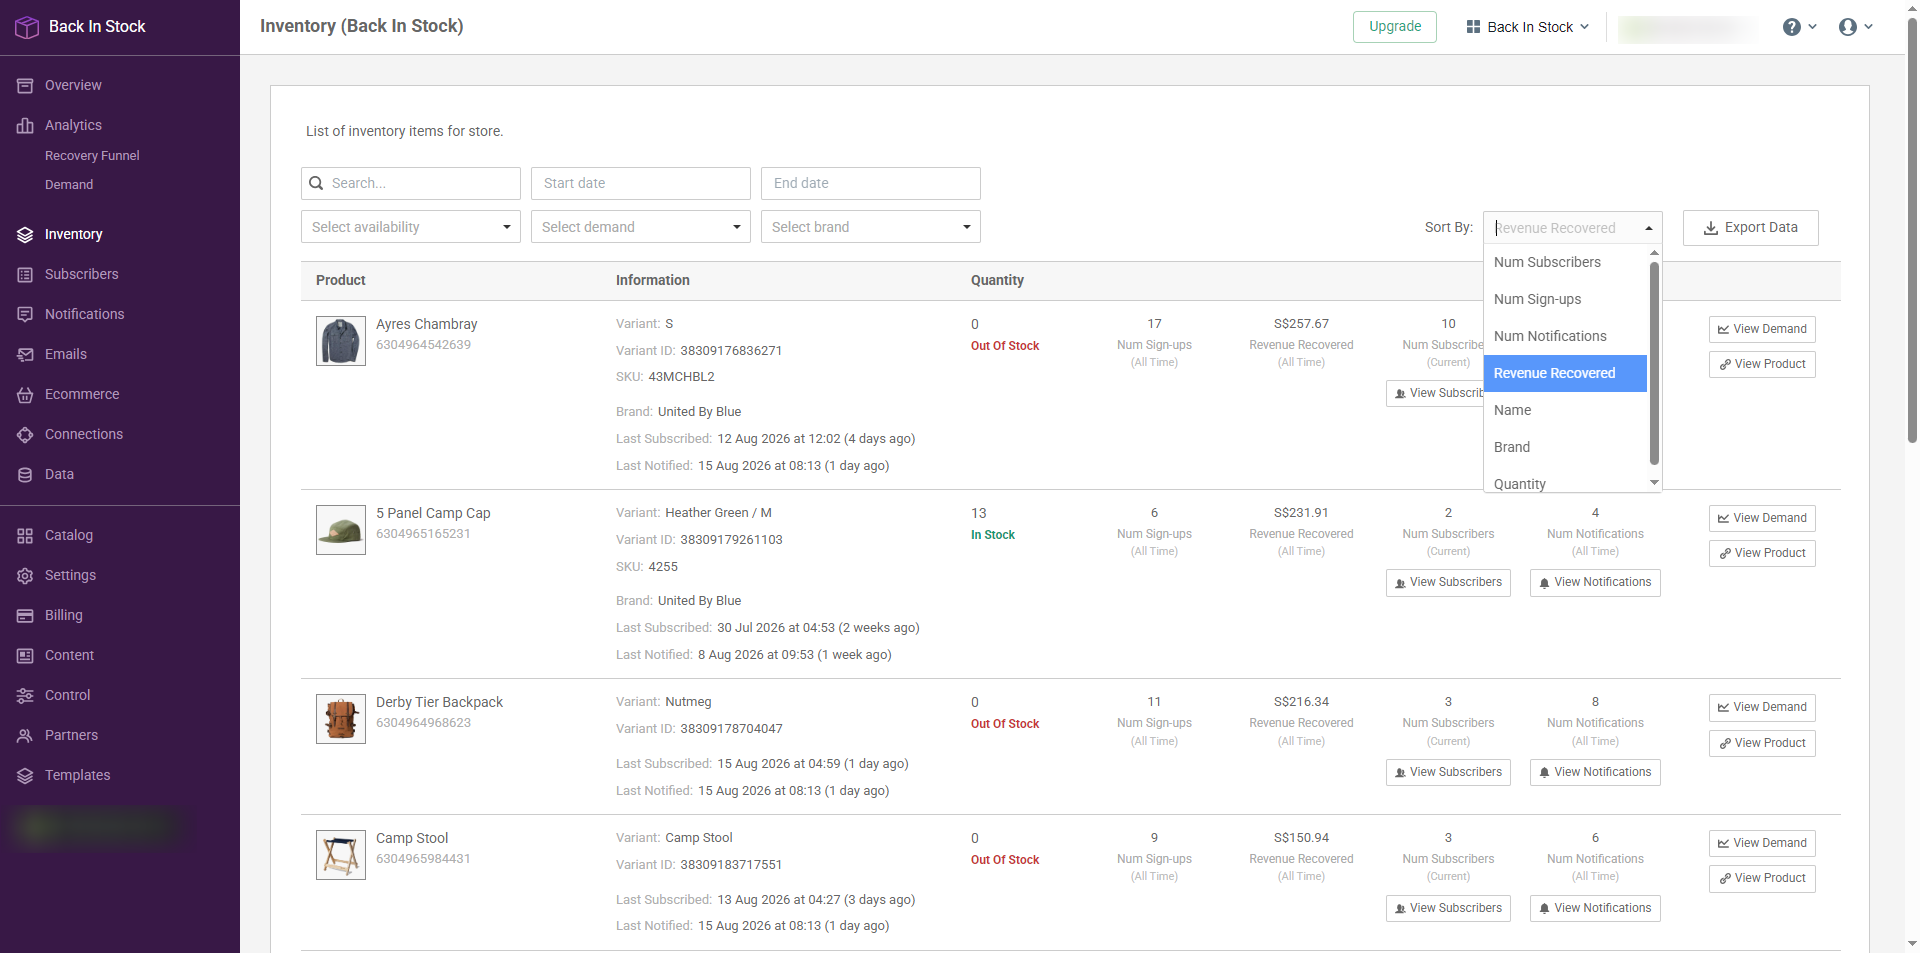
The inventory page, filtered to one brand and sorted by Revenue Recovered.
What should I reorder?
Sort by Num Sign-ups for what people asked about most, or Num Subscribers for what they're still waiting on.
Honestly though, the combination is the one you'll use.
Set Availability to Out Of Stock
Set Demand to Has Subscribers
Sort by Num Subscribers
That's everything you can't currently sell that someone's waiting to buy, ranked. It's basically a purchase order.
Before you act on it, glance at Last Subscribed on each row. 40 people waiting since last week and 40 waiting since last autumn are not the same situation. The count on its own won't tell you which one you're looking at.
Yeah, but which variant, which size/color?
This one's easy now. The list is per variant rather than per product.
Search the product and read the rows against each other. Ordering the same quantity of every size is how you end up sitting on mediums and short on smalls, and this is the list that stops it.
If you'd rather see the actual people than the number, View Subscribers on any row pulls up the shoppers waiting on that exact variant.
Why is this back in stock with people still waiting on it?
Set Availability to In Stock and Demand to Has Subscribers.
Most of the time that list is just alerts in flight and it clears itself out. If something sits there, look at it. You couldn't ask this question before.
Demand Analytics
Is this brand worth reordering?
Drop the brand into the filter and everything below it is that brand only. Works on the inventory page, and on the new Demand report.
Demand is the better one for this. Same numbers, but you can point it at everything you sell, at one brand, or at one product across all its variants. And you get charts over time rather than a single figure sitting on its own, which is the whole difference here.
The sign-ups chart is the one I'd look at. Climbing means the waitlist is still filling and a restock has an audience waiting for it. Flat means the moment's passed, whatever the total says.
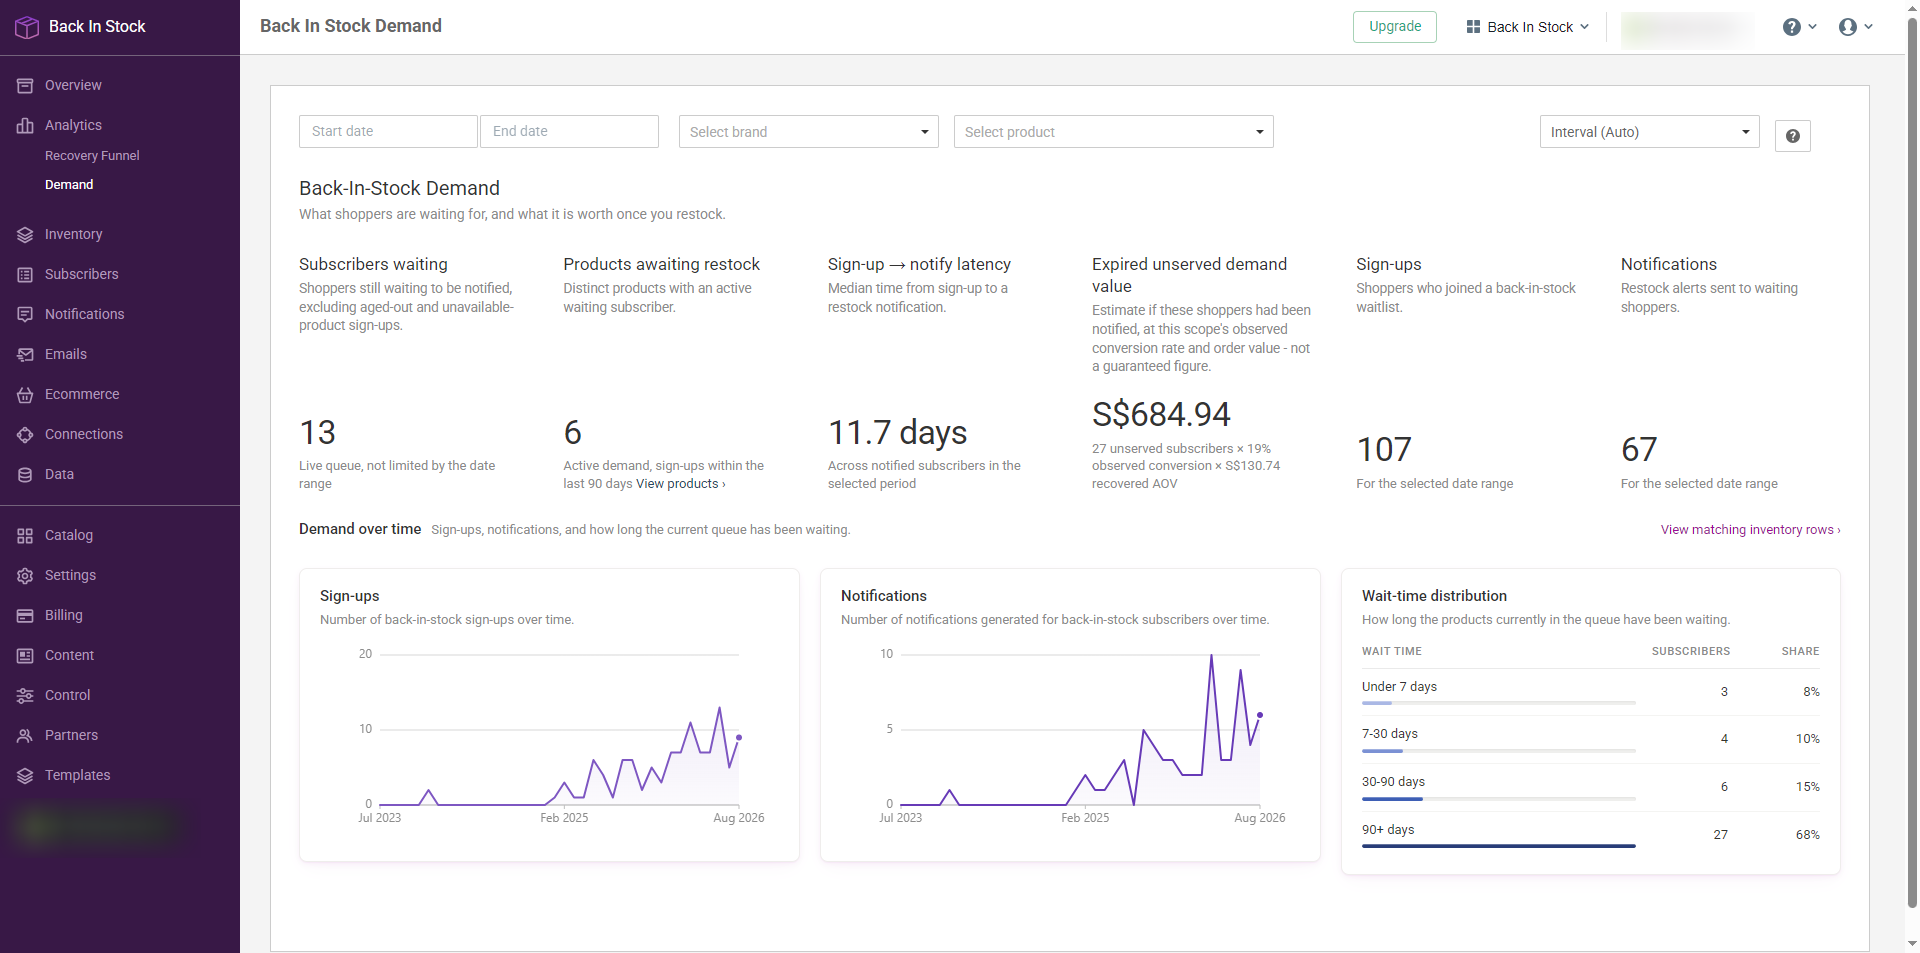
Demand, unfiltered - everything you sell, at a glance.
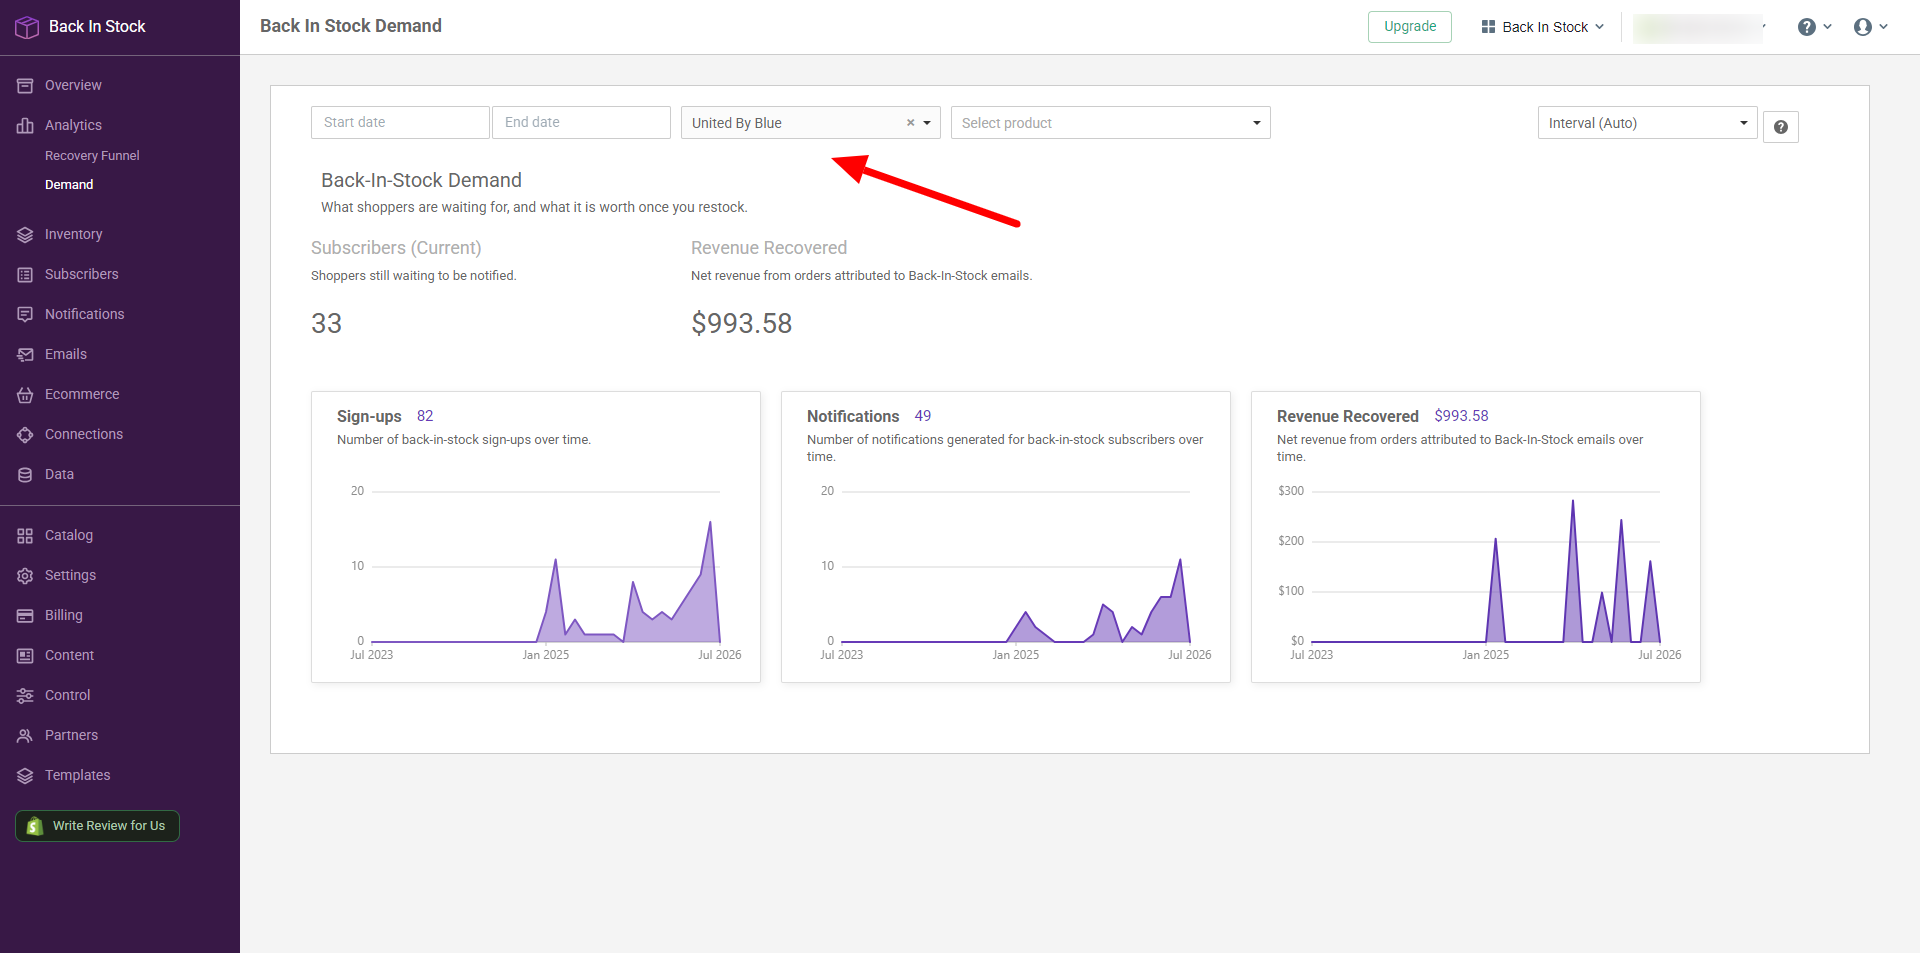
Demand for one brand.
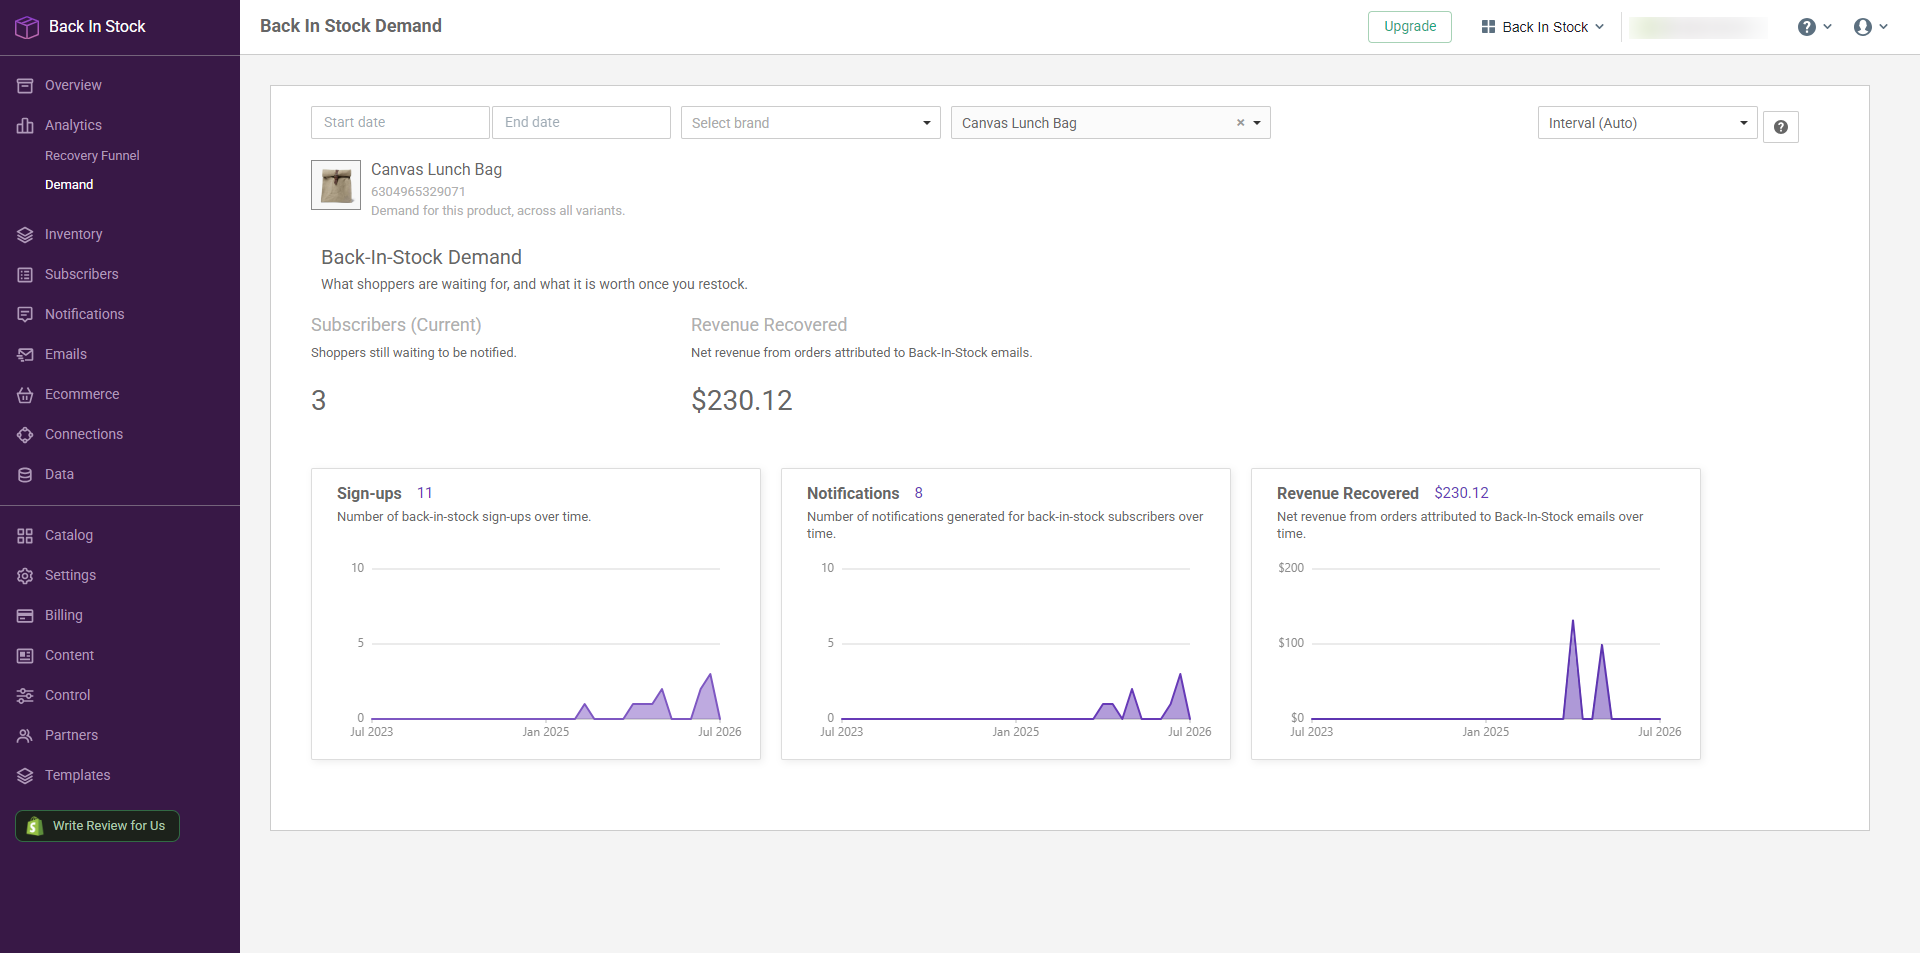
Demand for one product, across every variant.
Recovery Funnel Analytics
Is any of it actually working?
That's the Recovery Funnel, which went in a few weeks back. Take everyone who joined a waitlist in a period, then see how many got notified and how many bought.
There are 4 numbers here.
Deliverability tells you the alerts arrive at all
Notify to Buy Rate is what happens once they do
Revenue Recovered puts a figure on it
Subscribers is everyone still queued behind, waiting on the next restock
Good deliverability with a bad buy rate is an offer problem, not a sending problem. Knowing which of the two you've got is most of the fix.
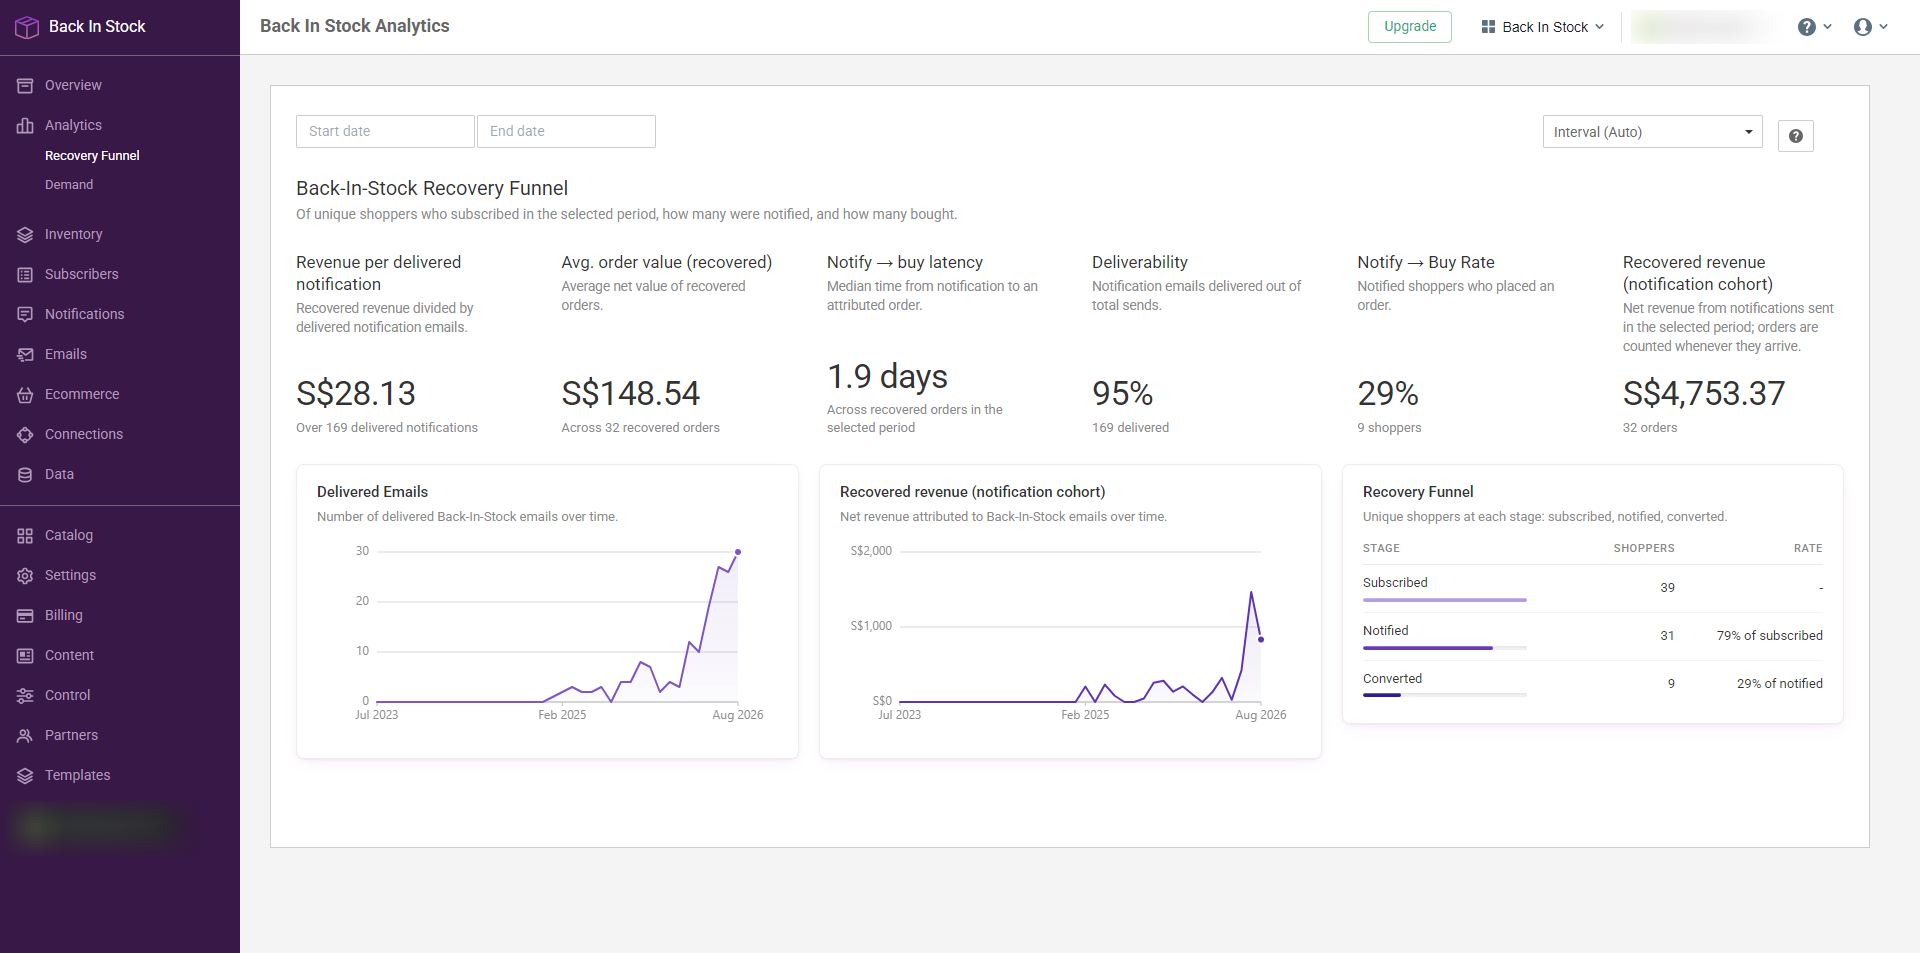
The Recovery Funnel: subscribed, notified, converted.
Sign-ups vs Subscribers
Worth 30 seconds, because both turn up on every screen above and people do get caught out.
Sign-ups is everyone who ever joined a waitlist.
Subscribers is who's still waiting right now. Once you get your alert you stop being a subscriber, but your sign-up stays counted.
So the two will never match, and that's fine. The gap between them is everyone you've already notified.
The bit that catches people out is that Subscribers ignores the date range. It's a live count, so letting a date filter change it would make it mean something else entirely. Everything else follows the dates.
We label it rather than expect you to remember.
Sign-ups, revenue and notifications say
(All Time)until you set a date range, and(Period)after thatSubscribers always says
(Current)
Export Data
This one's a fix more than a feature.
The CSV export used to hand you product titles and SKUs and not a lot else, which meant it was missing every number the page exists for. That's fixed. It now carries sign-ups, subscribers, notifications and recovered revenue, plus last subscribed and last notified in your own timezone.
It respects whatever filters you've got set, and it gives you the whole filtered list rather than the page you happen to be looking at.
Conclusion
If you run Back In Stock, this is worth 10 minutes today. Open the inventory page, sort by Revenue Recovered, and see what the last year actually earned you. Most people are surprised by what's near the top.
Next round is aimed at the restock decision itself rather than at the reporting around it.
And if there's something you want to ask your waitlist and can't, hit reply and tell us. Most of the above came from people doing exactly that.